Dividend Aristocrats Portfolio Analysis: Tracker Guide
TL;DR
- ▸Dividend Aristocrats: S&P 500 companies with 25+ years of consecutive dividend growth — the elite dividend payers.
- ▸Why tracking is complex: DRIP, yield-on-cost evolution, dividend growth rate and multi-year income comparison require more than a broker statement.
- ▸DonkyCapital: tracks dividend income year-by-year, shows heatmap, calculates yield-on-cost and supports CSV import from major brokers.
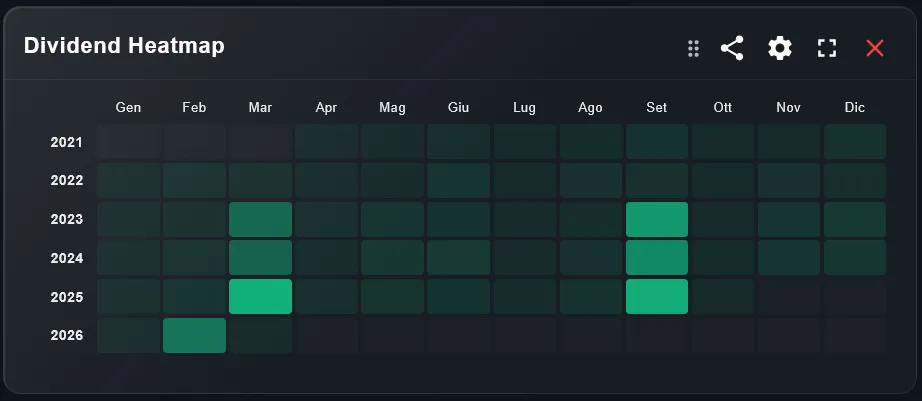
- ▸Income heatmap: visualise which months and stocks generate the most dividend income.
- ▸Free plan available: start tracking your dividend growth portfolio today.
Dividend Aristocrats — S&P 500 companies with 25 or more consecutive years of dividend growth — represent one of the most disciplined investment strategies available. But tracking a Dividend Aristocrats portfolio goes beyond monitoring price: you need yield-on-cost, dividend growth rate, DRIP calculations and income heatmaps.
This guide shows how to build and track a Dividend Aristocrats portfolio using DonkyCapital: from importing transactions to analysing your real dividend income growth year by year.
What Are Dividend Aristocrats?
Dividend Aristocrats is a title given to S&P 500 companies that have increased their dividend payout for at least 25 consecutive years. As of 2026, the index contains around 65 companies across sectors like consumer staples, healthcare, industrials and financials.
Well-known Dividend Aristocrats include Johnson & Johnson, Procter & Gamble, Coca-Cola, Realty Income and 3M. The European equivalent — EURO STOXX Select Dividend — applies similar criteria to European-listed companies.
Criteria for Dividend Aristocrat Status
- ▸Member of the S&P 500 index
- ▸At least 25 consecutive years of dividend increases
- ▸Minimum market capitalisation and liquidity requirements
Why Does Tracking a Dividend Portfolio Require More Than a Broker Statement?
A broker statement shows you payments received. But serious dividend growth investors need to analyse much more:
- Yield-on-cost: your current dividend yield based on what you originally paid, not today's price — shows your true passive income growth.
- DRIP (Dividend Reinvestment Plan): if you reinvest dividends automatically, each reinvestment creates a new lot with its own cost basis.
- Dividend growth rate: how fast each holding is growing its payout year-over-year — the key metric for dividend growth investing.
- Income diversification: which months are heavy vs light on dividend payments — heatmap analysis helps smooth cash flow planning.
How Does DonkyCapital Track Dividend Aristocrats Portfolios?
DonkyCapital is designed with dividend investors in mind. Import your transactions from Degiro, Scalable Capital, Fineco or Interactive Brokers via CSV and the platform automatically tracks all dividend activity.
Performance comparison — track your Dividend Aristocrats returns against the S&P 500 benchmark.
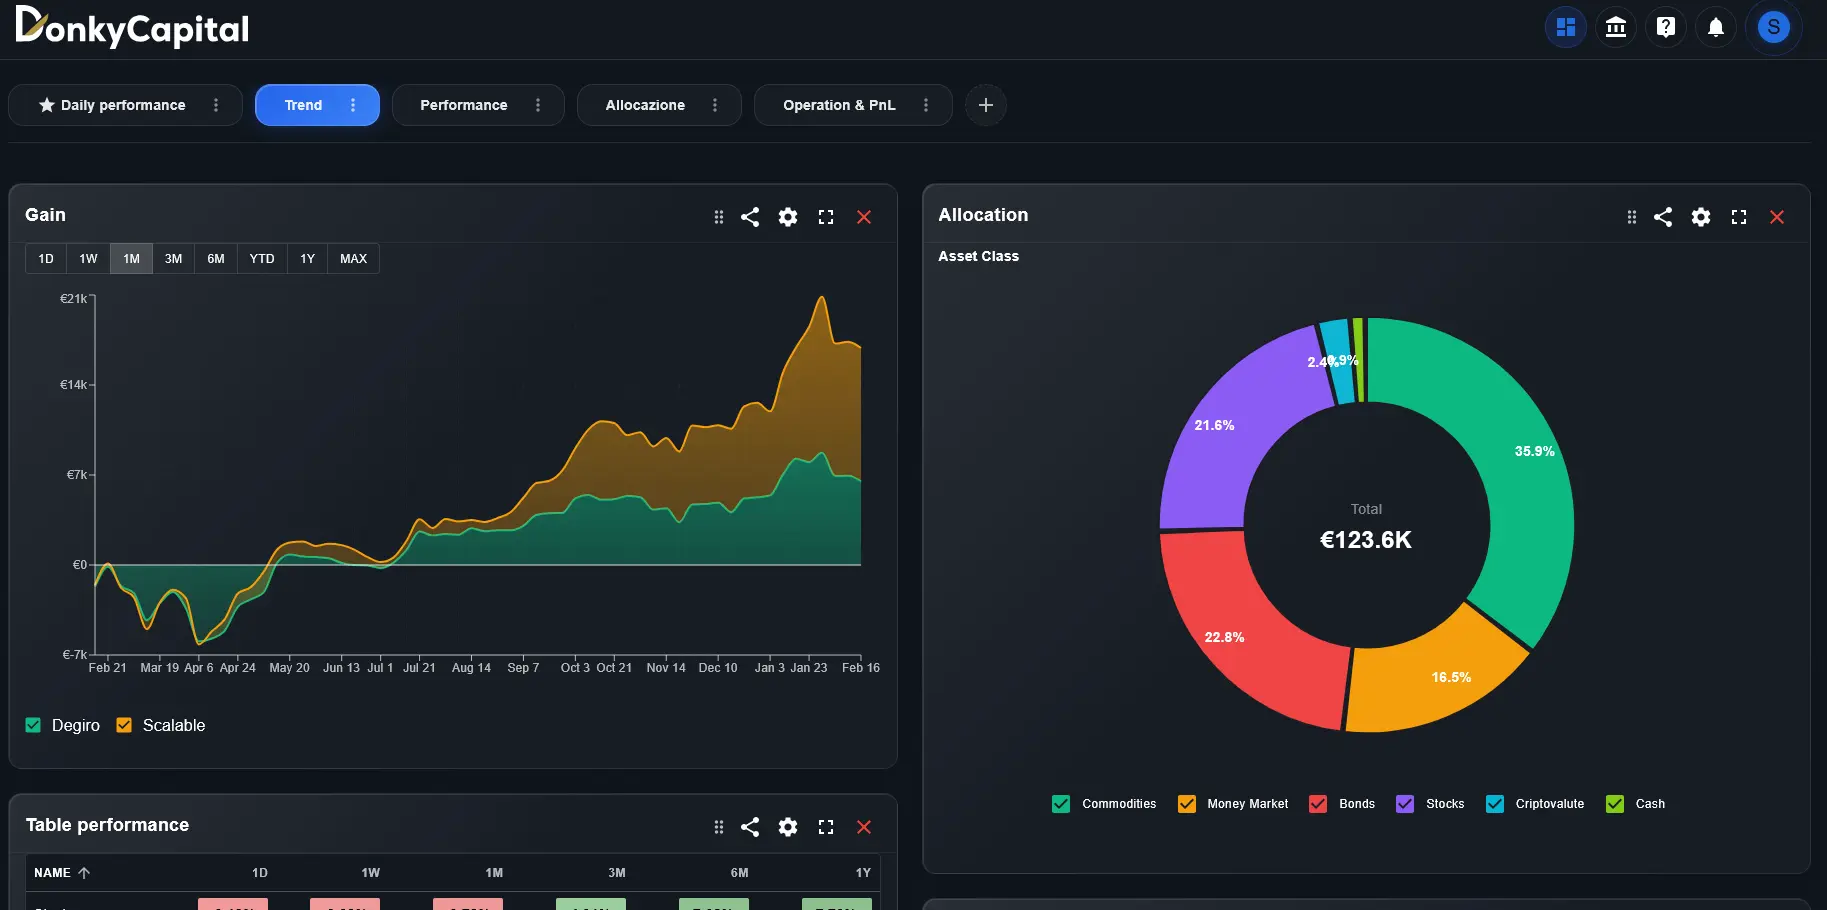
DonkyCapital dashboard — unified dividend income tracking across all holdings.
- Dividend income history: year-by-year income tracking showing exactly how your passive income is growing.
- Yield-on-cost: calculated automatically per holding — see how your effective yield has grown since purchase.
- Dividend heatmap: visual monthly breakdown showing which months generate the most income across your portfolio.
- Benchmark comparison: compare your Dividend Aristocrats total return (price + dividends) against the S&P 500 or custom index.
Building a Dividend Growth Portfolio Strategy
A Dividend Growth strategy prioritises companies with long track records of increasing payouts over those with the highest current yield. The goal is yield-on-cost — buying quality compounders early so that your effective yield grows substantially over time. DonkyCapital helps you monitor this evolution year after year.
Common portfolio construction approaches include selecting 20-30 Aristocrats across sectors to avoid concentration, weighting by conviction or equal-weighting for simplicity, and reinvesting dividends to accelerate compounding. DonkyCapital tracks all of this with real transaction data.
Frequently Asked Questions
What is yield-on-cost and why does it matter for Dividend Aristocrats investors?
Yield-on-cost is your annual dividend income divided by your original purchase price (not the current market price). It shows your true return on invested capital and grows over time as companies increase their dividends. DonkyCapital calculates this automatically per holding.
Can I track DRIP (dividend reinvestment) in DonkyCapital?
Yes. Each dividend reinvestment is logged as a new buy transaction with its own cost basis. DonkyCapital tracks the full transaction history including reinvestments.
How do I import Dividend Aristocrats holdings from Degiro or Scalable Capital?
Export your account statement as CSV from your broker, then import it into DonkyCapital. The platform parses buy/sell and dividend transactions automatically.
Does DonkyCapital show a dividend calendar?
DonkyCapital shows historical dividend income by month and year. Forward-looking dividend calendar features based on expected payment dates are on the product roadmap.
What is the difference between Dividend Aristocrats and Dividend Kings?
Dividend Aristocrats require 25+ years of consecutive dividend increases. Dividend Kings require 50+ years — an even more exclusive group including companies like Coca-Cola and Procter & Gamble. Both can be tracked in DonkyCapital.
Start Tracking Your Dividend Aristocrats Portfolio
Import your transactions, track yield-on-cost evolution and monitor your dividend income growth year by year — all in one privacy-first dashboard with DonkyCapital.
Try DonkyCapital FreeFree plan available. No credit card required.