How to Track Currency Risk in Your Portfolio with the FX Rates Widget
Currency fluctuations are one of the most overlooked sources of risk and return for retail investors. If you hold US dollar-denominated ETFs in a euro-based account, a 10% dollar depreciation can wipe out an equivalent 10% gain in the underlying asset. The FX Rates widget makes currency movements visible so you can factor them into your portfolio decisions.
This guide explains what the widget shows, how to configure it for your base currency, and how to use exchange rate data to understand your true portfolio exposure.
TL;DR
- ✓Why Does Currency Risk Matter for ETF Investors?
- ✓What Does the FX Rates Widget Show?
- ✓How Do You Configure the FX Rates Widget?
- ✓How Do You Use FX Data to Understand Your Portfolio?
- ✓Should You Hedge Currency Risk?
Why Does Currency Risk Matter for ETF Investors?
Most globally diversified ETFs are priced in a single currency — often USD or EUR — but hold assets denominated in dozens of currencies underneath. When you buy a world equity ETF priced in EUR, you are exposed to movements in USD, JPY, GBP, and every other currency held by the underlying companies. The ETF price in EUR reflects both the performance of those companies and the currency exchange rates.
This means your returns are never purely about market performance. In years where the dollar strengthens against the euro, euro-based investors in US equity ETFs get a currency tailwind. In years where the dollar weakens, they face a headwind. The FX Rates widget makes this dynamic visible before it shows up unexpectedly in your portfolio returns.
You invest in assets. Currency moves in the background, silently adding or subtracting from your returns.
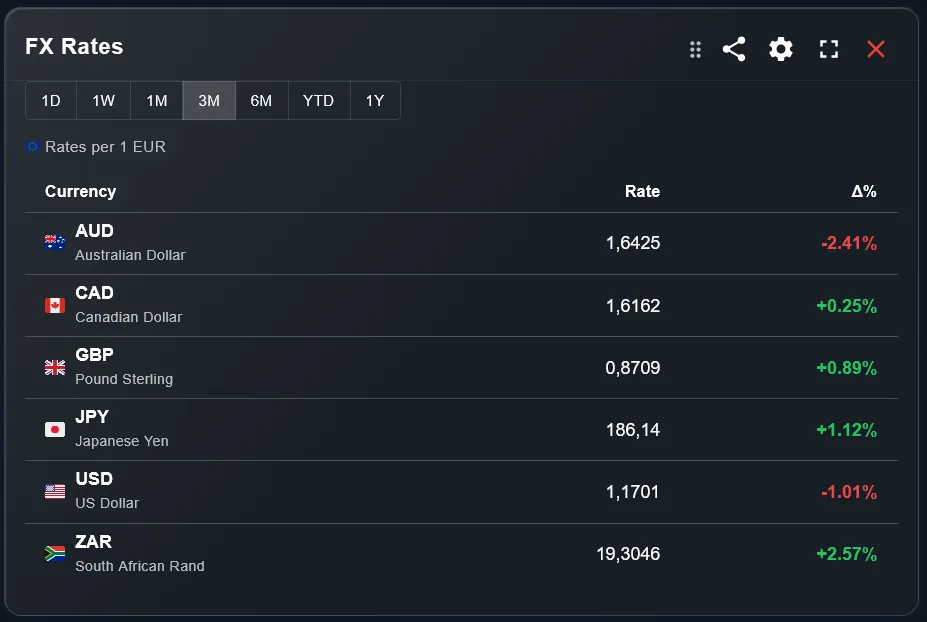
What Does the FX Rates Widget Show?
The widget displays a table of exchange rates relative to a base currency of your choice. Each row shows a currency pair, the current exchange rate, and the percentage change over the selected time period. Currencies that have strengthened against the base are shown with positive changes; those that have weakened show negative changes.
The percentage change column is the most actionable part of the widget. It shows directly how much value investors with exposure to each currency have gained or lost through currency movements alone — independent of the underlying asset performance.
How Do You Configure the FX Rates Widget?
Two settings control the widget. The base currency sets the reference point for all exchange rate calculations. If your portfolio is denominated in EUR, set EUR as the base and all other currencies will be shown as their value in EUR terms. If your account is in GBP or USD, select accordingly.
The currency selection lets you choose which currencies to display. The default shows the most common global currencies relevant to diversified investors. You can narrow it down to only the currencies you actually have exposure to — for example, USD, JPY, and GBP if your ETFs cover North America, Japan, and the UK.
How Do You Use FX Data to Understand Your Portfolio?
The most direct use is checking currency moves when your portfolio has an unexpected gain or loss. If your portfolio is up 2% in a week where markets were flat, check the FX widget: a strengthening of a currency you are heavily exposed to is likely the cause.
- Check the 1-week or 1-month column for the currencies your ETFs are exposed to.
- A positive change means those currencies strengthened against your base — a tailwind for your portfolio.
- A negative change means those currencies weakened — a headwind that reduced your real returns.
- Compare the FX move magnitude to your portfolio's movement to estimate how much of your return came from currency versus market performance.
Should You Hedge Currency Risk?
Currency hedging is a complex topic. Hedged ETFs eliminate currency risk but also remove the potential upside from favorable currency moves. They also typically carry a slightly higher cost ratio. For long-term investors with horizons of ten years or more, currency effects tend to average out over time.
The FX Rates widget helps you monitor whether you are experiencing a sustained currency headwind or tailwind. If the same currency has been moving consistently against you for several quarters, it may be worth reviewing whether hedged alternatives make sense for your situation.
Which Time Period Is Most Useful?
For daily monitoring, the 1-day view shows the latest currency moves from the most recent market session — useful for understanding short-term fluctuations after major economic announcements. For portfolio analysis, the 1-month or 3-month view gives a more meaningful picture of the currency environment you have been investing in.
The 1-year view is the most useful for annual portfolio reviews: it shows the full-year currency contribution to your returns, which you can compare directly to the performance figures shown by the Performance Table widget for the same period.
How Does the FX Widget Complement the Rest of Your Dashboard?
Use the FX Rates widget as a diagnostic tool alongside performance widgets. When the Portfolio Trends chart shows an unexpected spike or dip, the FX widget often explains it. When the Performance Table shows a strong month that does not match the market news you have been following, currency moves are frequently the explanation.
For investors who hold ETFs in multiple currencies across multiple brokers, keeping the FX Rates widget visible on the main dashboard turns a hidden variable into a tracked one — which is the first step toward managing it intentionally.
Frequently Asked Questions
Does the widget show real-time exchange rates?
Exchange rates update on a regular refresh cycle. For the 1-day view, rates reflect the most recent available data. For longer periods, closing rates are used.
Can I set any currency as the base?
Yes. The base currency can be set to any major currency including EUR, USD, GBP, JPY, CHF, and others. Select the currency that matches your portfolio's denomination.
Does DonkyCapital automatically apply exchange rates to my portfolio?
Yes. All portfolio values are converted to your account's base currency using historical exchange rates at the time of each transaction. The FX Rates widget shows current and historical rates separately for reference.
What is the difference between the FX Rates widget and the currency grouping in the Line Chart?
The FX Rates widget shows standalone exchange rate data — the rates themselves and how they move. The Line Chart widget with currency grouping shows how your portfolio's value has evolved when split by currency denomination of your holdings. They answer different questions.
Can I hide currencies I am not exposed to?
Yes. Use the currency selection setting to show only the currencies relevant to your portfolio. Hiding irrelevant pairs makes the widget more readable.
How do I know which currencies my ETFs are exposed to?
The currency exposure of an ETF depends on the currencies of its underlying holdings, not the currency in which the ETF itself is priced. Check the ETF provider's factsheet for a full currency breakdown. The FX widget helps you monitor the ones you identify as relevant.
Track Currency Risk Alongside Your Portfolio
DonkyCapital combines exchange rate data with your portfolio performance in one dashboard. Understand your real returns — after currency effects.
Start for free