How to Monitor All Your Open Positions in One Place with the Holdings Summary Widget
Tracking what you currently hold across multiple broker accounts is harder than it sounds. Different brokers show positions differently, use different currencies, and calculate average purchase prices in inconsistent ways. The Holdings Summary widget solves this by consolidating all your open positions into a single, unified view.
This guide explains what the widget shows, how average purchase price is calculated, and how to use the live position data to make faster, better-informed decisions.
TL;DR
- ✓Why Is a Unified Holdings View Important?
- ✓What Does the Holdings Summary Widget Display?
- ✓How Is Average Purchase Price Calculated?
- ✓How Do You Configure the Holdings Summary Widget?
- ✓How Do You Use the Holdings Summary for Position Management?
Why Is a Unified Holdings View Important?
Most investors with more than one broker account have experienced the friction of toggling between apps to get a complete picture of what they own. Each broker shows its own slice of the portfolio, uses its own currency, and calculates returns in its own way — making it nearly impossible to see the whole without building a spreadsheet.
The Holdings Summary widget eliminates this by pulling all transactions from all connected brokers into a single table. One row per asset, with consistent calculations applied across the board. This is the foundation for every other analytical widget — you need to know what you hold before you can analyze performance, allocation, or risk.
You cannot understand your portfolio as a whole until you can see it as a whole.
What Does the Holdings Summary Widget Display?
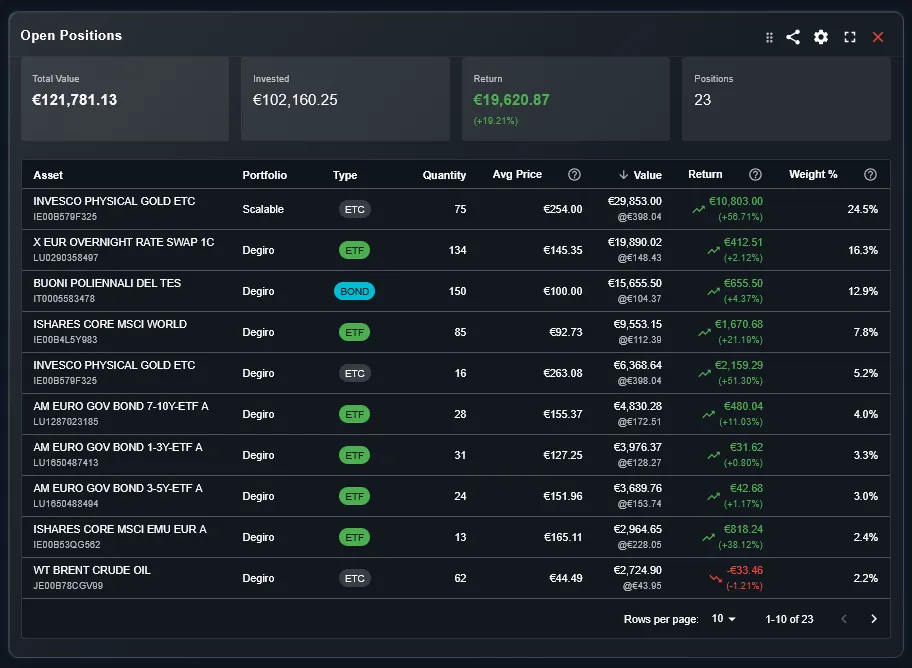
The widget shows a table where each row represents an open position — an asset you currently hold. The columns show key data for each position: the asset name, the quantity held, the average purchase price (also called cost basis or PMC), the current market price, the current value in your base currency, and the unrealized gain or loss.
The unrealized gain column shows both the absolute monetary gain and the percentage return relative to your cost basis. This tells you not just whether a position is profitable, but by how much — and at what scale relative to your total investment in that asset.
How Is Average Purchase Price Calculated?
Average purchase price — referred to as PMC (Prezzo Medio di Carico) in Italian — is calculated as the weighted average of all your purchase transactions for a given asset. If you bought 10 shares at 100 EUR and then 10 more at 120 EUR, your average purchase price is 110 EUR, and your total cost basis is 2,200 EUR.
This calculation accounts for all transactions including reinvested dividends, if applicable. The widget uses this figure consistently so that the unrealized gain shown is always the true difference between what you paid and what the position is worth today.
How Do You Configure the Holdings Summary Widget?
The widget has two main configuration options. The portfolio filter selects which broker accounts to include — you can view all positions combined or isolate a single portfolio. This is useful if you want to see holdings per broker rather than the consolidated total.
The column configuration lets you show or hide specific columns depending on what information you find most useful. If you only care about current value and unrealized gain, you can hide cost basis and quantity columns to keep the view clean. The configuration is saved per widget instance.
How Do You Use the Holdings Summary for Position Management?
The most common use is a daily or weekly portfolio check. Scanning the unrealized gain column shows immediately which positions have moved significantly since you last looked. Large positive moves might prompt you to check whether rebalancing is needed; large negative moves prompt a review of whether the investment thesis still holds.
The widget also serves as a quick sanity check after importing new transactions. After adding a trade, the holdings summary shows whether the position size updated correctly and whether the new average purchase price reflects your actual cost basis. Any discrepancy signals an import error worth investigating.
What Is the Difference Between Holdings Summary and Portfolio Table?
Both widgets show portfolio data in a table format, but they focus on different levels of aggregation. The Portfolio Table shows data at the portfolio level — one row per portfolio — with metrics like total invested capital, total returns, and fees. It answers the question of how each portfolio is performing as a whole.
The Holdings Summary shows data at the individual position level — one row per asset. It answers the question of what you own and at what cost. Use Portfolio Table for strategy-level analysis and Holdings Summary for position-level monitoring.
Can You See Holdings Across Multiple Brokers in One Table?
Yes. This is the primary use case the widget was designed for. When you have positions in the same asset across two different brokers — for example, the same ETF bought at different times at DEGIRO and Scalable Capital — DonkyCapital consolidates them into a single row with a blended average purchase price.
Alternatively, if you prefer to see each broker's holdings separately, use the portfolio filter to show one broker at a time. Both views are available without creating duplicate widgets.
Frequently Asked Questions
Does the widget show only open positions?
Yes, the Holdings Summary focuses on positions you currently hold. For analysis of closed and sold positions, use the P&L widget which covers both open and closed trades.
How does the widget handle the same ETF held at multiple brokers?
By default, the widget consolidates holdings of the same asset across all brokers into a single row with a blended average purchase price. Use the portfolio filter to see broker-by-broker holdings instead.
Are dividend reinvestments included in the cost basis?
If you record dividend reinvestments as purchase transactions in DonkyCapital, they are included in the cost basis calculation. This gives you a more accurate representation of your true cost per share.
How current is the market price shown?
Market prices update on a regular refresh cycle using data from financial data providers. For assets with active trading, prices reflect the most recent available quote.
Can I customize which columns appear?
Yes. The column configuration setting lets you show or hide specific data columns. Changes are saved per widget instance so each configuration persists across sessions.
What happens to a position after I sell it?
Once all shares of a position are sold, it disappears from the Holdings Summary and moves to the closed positions view in the P&L widget. Partial sales reduce the quantity shown in the Holdings Summary.
Does the widget support fractional shares?
Yes. Quantity and value calculations support fractional shares as reported by your broker transaction data.
See All Your Positions in One Place
Connect your broker accounts and DonkyCapital consolidates all your holdings into a single live view — with consistent cost basis calculations across every account.
Start for free