How to Monitor Global Stock Markets at a Glance with the Indices Map Widget
Markets do not move in isolation. When US equities sell off, European markets often follow. When emerging markets surge, the ripple effect shows up across asset classes. The Indices Map widget puts the global picture in front of you with a single look — a world map showing major stock indices and their performance over any selected period.
This guide explains what the widget shows, how to configure it, and how to use it to understand market context when analyzing your own portfolio.
TL;DR
- ✓Why Does a Global Market Map Matter for Portfolio Investors?
- ✓What Does the Indices Map Widget Show?
- ✓How Do You Configure the Indices Map Widget?
- ✓Which Time Period Is Most Useful?
- ✓How Do You Use the Map Alongside Your Portfolio?
Why Does a Global Market Map Matter for Portfolio Investors?
Most retail investors hold globally diversified ETFs — world index funds that span dozens of countries. When you see your portfolio down 3%, the natural question is whether this is a personal allocation problem or a broad market event. The Indices Map answers that question instantly: if every major index is red, the move is systematic; if only your specific markets are down, the issue is more specific.
Understanding this distinction changes how you respond. A broad global selloff rarely calls for action. A sector or region-specific decline might signal something worth investigating in your allocation.
Markets are global. Your dashboard should be too.
What Does the Indices Map Widget Show?
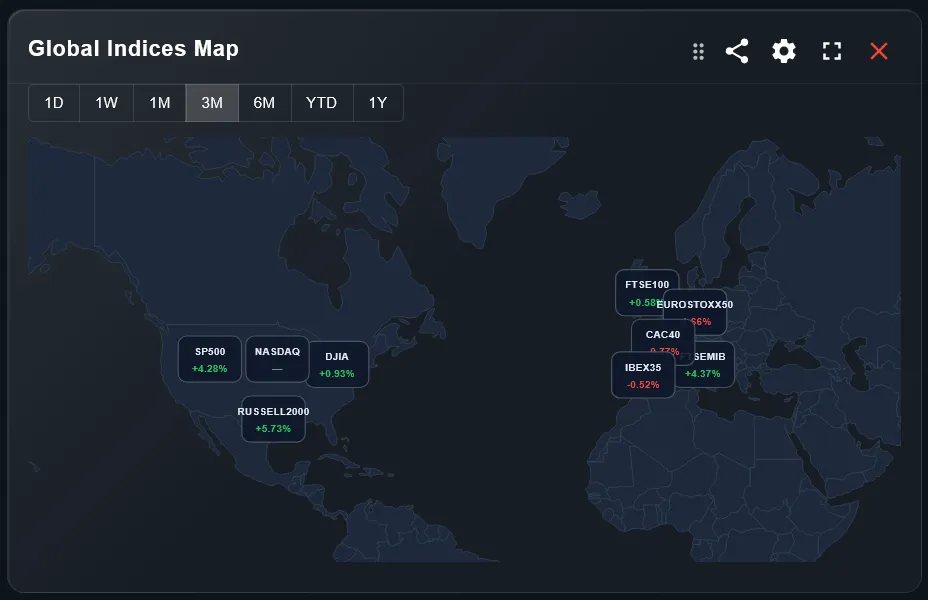
The widget displays a world map with markers positioned over major financial centers. Each marker shows the name of a stock index and its percentage change over the selected time period. Positive returns are shown in green, negative returns in red, with color intensity scaling to the magnitude of the move.
This visual format makes it immediately clear where strength and weakness are concentrated geographically. A quick scan tells you whether the US, Europe, and Asia are moving together or diverging — information that would take several minutes to gather from separate financial news sources.
How Do You Configure the Indices Map Widget?
Two settings control the widget output. The time period determines the performance window shown on each index marker — you can view daily moves for a market session snapshot, or extend to weekly, monthly, quarterly, or annual returns to see the longer trend.
The region setting focuses the map on a specific area of the world. The default Atlantic view centers the map to show both North America and Europe simultaneously — the most useful starting point for investors holding global developed market exposure. You can switch to a Europe-only, Americas-only, or Asia-Pacific view depending on where your portfolio is concentrated.
Which Time Period Is Most Useful?
The right time period depends on what question you are trying to answer. For daily market context — understanding what moved while you were away from the screen — the 1-day view is the most actionable. For understanding whether a recent portfolio drawdown is part of a broader trend, the 1-month or 3-month view gives better context.
The 1-year view is the most useful for strategic portfolio review: it shows which regions have led and which have lagged over a full market cycle, which directly informs allocation decisions for long-term investors.
How Do You Use the Map Alongside Your Portfolio?
The most effective use of the Indices Map is as a context layer for your other widgets. When the Portfolio Trends widget shows a drawdown, check the map to see whether it is market-wide. When the Performance Table shows a weak month for your equity allocation, the map shows whether international equity indices had a similar month.
Place the Indices Map on a dashboard tab alongside performance widgets rather than making it the main view. It is a reference tool — powerful for answering one-off questions about market context — not a primary analytics widget.
Which Indices Are Shown on the Map?
The map includes the major equity indices from the world's largest financial markets, covering North American, European, and Asian markets. The selection covers the indices that are most relevant to retail investors holding global or regional ETFs.
The indices shown correspond to the benchmark codes available in DonkyCapital's benchmark system, which is the same set used by the Line Chart widget for benchmark comparisons. This means you can use the map to identify which regional index to use as a benchmark for your portfolio.
Does the Widget Update in Real Time?
Index data is updated on a regular refresh cycle. For the 1-day view, prices reflect the most recent available data from each market's trading session, accounting for different time zones. Markets that are currently closed show their last closing price.
For longer time periods — weekly, monthly, and beyond — the data is calculated from closing prices and updates at the end of each trading day. This makes the map reliable for strategic analysis even if it is not a live trading screen.
Frequently Asked Questions
How many indices are shown on the map?
The map shows the major equity indices from the world's largest markets. The exact selection covers all key developed and major emerging market indices relevant to globally diversified investors.
Can I click on an index to see more detail?
The map shows the index name and its return for the selected period. For deeper analysis of a specific index or region, use the Line Chart widget with the corresponding benchmark selected.
Does the map show bond or commodity indices?
The current version focuses on equity indices. Bond and commodity benchmarks are available in the Line Chart widget's benchmark selector for performance comparison purposes.
Can I use this widget to decide when to rebalance?
The map gives you market context but not a rebalancing signal on its own. For structured rebalancing alerts, use the Rebalancing Alert widget which compares your actual allocation against your target ranges.
Does currency affect the index returns shown?
Indices are shown in their local currency by default. A European index return shown on the map reflects the EUR-denominated return. Currency effects on your portfolio are captured separately in the FX Rates widget.
What does the region filter do exactly?
The region filter adjusts the map's zoom and center point to focus on a specific geographic area. It does not remove indices from other regions — it simply changes what is visible in the viewport without scrolling.
See the Full Market Picture on Your Dashboard
DonkyCapital brings global market data and your personal portfolio into one dashboard. No switching between apps, no manual lookups.
Start for free