How to Measure and Manage Your Portfolio Risk with the Volatility Widget
Return is only half the story. Two portfolios can have the same annual return but one swings 30% down in a bad year while the other barely moves. The Portfolio Volatility widget quantifies this difference so you can understand not just how much your portfolio earns — but how smoothly it gets there.
This guide explains what the volatility widget measures, how to interpret the numbers, and how to use them to build a portfolio that matches your real risk tolerance.
TL;DR
- ✓What Does the Portfolio Volatility Widget Measure?
- ✓How Is Volatility Calculated in DonkyCapital?
- ✓What Is a Good Volatility Level for Your Portfolio?
- ✓How Do You Use the Volatility Widget?
- ✓What Does It Mean When Volatility Spikes Suddenly?
What Does the Portfolio Volatility Widget Measure?
The widget calculates the annualized standard deviation of your portfolio returns — the most common statistical measure of volatility. A high number means your portfolio value fluctuates widely day to day. A low number means it moves more steadily.
For context: a typical global equity ETF like MSCI World has annualized volatility around 14-16% in normal market conditions. A bond-heavy portfolio might sit at 5-8%. A crypto-heavy portfolio can exceed 50-60%.
Risk is not just losing money. It is the uncertainty of not knowing where your portfolio will be tomorrow.
How Is Volatility Calculated in DonkyCapital?
DonkyCapital calculates portfolio volatility by measuring the standard deviation of your daily portfolio returns over the selected time window (typically 30, 90, or 365 days). This is then annualized by multiplying by the square root of 252 (the number of trading days in a year).
The calculation uses actual portfolio value changes — not individual asset volatility summed up — which means it naturally accounts for diversification benefits. Two assets that move in opposite directions reduce overall portfolio volatility even if each one is volatile alone.
What Is a Good Volatility Level for Your Portfolio?
There is no universally "good" volatility — it depends on your investment horizon and emotional tolerance. As a rough guide: 0-8% is conservative (cash, bonds, balanced funds), 9-18% is moderate (diversified equity portfolios), 19-30% is aggressive (concentrated equity, sector bets), above 30% is speculative (crypto, leveraged products).
The key question is not "is this volatility high?" but "can I tolerate a drawdown of 2-3x this number?" If your portfolio has 20% annualized volatility, it is statistically plausible to see a 40-60% drawdown in an extreme year.
How Do You Use the Volatility Widget?
Follow these steps to use the widget effectively:
- Open your DonkyCapital dashboard and navigate to the Volatility widget.
- Select the time window: 30-day volatility captures recent market conditions, 365-day captures a full-cycle view.
- Compare your portfolio volatility to benchmark indices shown in the widget. If your volatility is significantly higher than a global ETF for similar returns, your risk-adjusted return may be poor.
- Track how volatility changes after you add or remove positions. Adding uncorrelated assets typically reduces volatility.
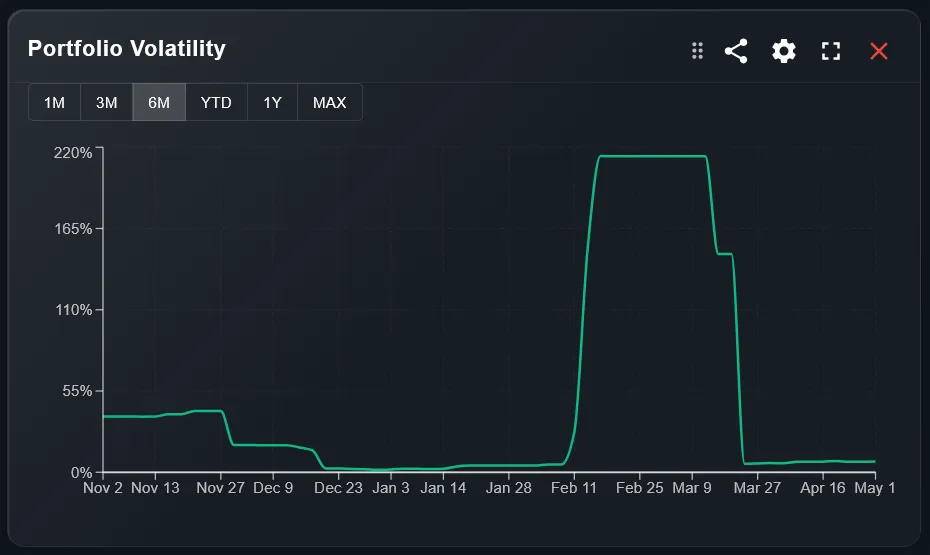
What Does It Mean When Volatility Spikes Suddenly?
A sudden spike in the 30-day volatility reading usually means a macro event hit the market — a rate decision, geopolitical shock, earnings surprise, or financial crisis. Your portfolio may have been caught in the turbulence.
This is useful diagnostic information: did your portfolio spike more or less than the market index? If your portfolio has higher volatility than the market during a downturn, your diversification may not be working as expected.
How to Reduce Portfolio Volatility Without Sacrificing Return
Use the volatility widget alongside these strategies:
- 1Add negatively or uncorrelated assets: bonds, gold, or real estate often move independently of equities and can reduce overall volatility.
- 2Reduce position concentration: a portfolio dominated by one stock or sector will have higher volatility than a diversified one with the same expected return.
- 3Review the Allocation Breakdown widget: if one asset class dominates, rebalancing toward your target can bring volatility closer to your intended risk level.
Is the Volatility Widget Available on Mobile?
Yes. The Volatility widget is available on mobile with a simplified display showing the current annualized volatility figure and a small sparkline of how it has trended over the last 30-90 days.
For the full breakdown — including volatility by time window, benchmark comparison, and historical chart — the desktop view provides a more complete picture.
Frequently Asked Questions
Is higher volatility always bad?
Not necessarily. Higher volatility can reflect higher expected return. The question is whether you are compensated for the risk — and whether you can emotionally tolerate large short-term swings.
How is portfolio volatility different from individual stock volatility?
Portfolio volatility accounts for correlations between holdings. Two volatile assets that move in opposite directions cancel each other out, resulting in lower portfolio volatility than either individually.
What time window should I use for the volatility calculation?
Use 30-day for a current market conditions snapshot, and 365-day for a stable long-term estimate. Short windows amplify recent events; long windows smooth them out.
Can volatility be zero?
In practice, no. Even a 100% cash portfolio has some volatility due to currency fluctuations if your base currency differs from the cash currency. A true zero-volatility portfolio does not exist in investment markets.
Why does my portfolio volatility seem lower than I expected?
Diversification is working. If you hold many assets across sectors and geographies with low correlations, your portfolio volatility will be significantly lower than the average volatility of individual holdings.
Does the widget show Sharpe ratio or risk-adjusted return?
Volatility is the input to risk-adjusted metrics. DonkyCapital displays volatility as a standalone metric; Sharpe ratio and similar measures may be available in the performance analytics section.
Know Your Real Portfolio Risk
Connect your brokers and get a full volatility analysis of your portfolio — for free.
Start for free