How to Track Every Gain and Loss in Your Portfolio with the P&L Widget
Knowing your portfolio's current value is easy. Knowing exactly how much you have gained or lost — on each position, across any time period, separating open from closed trades — is much harder. The Profit & Loss widget on DonkyCapital solves this in one place.
This guide covers what the widget shows, how to configure it for your situation, and how to use it to make better decisions about when to hold, sell, or harvest a tax loss.
TL;DR
- ✓Why Is Tracking P&L More Complex Than It Looks?
- ✓What Does the P&L Widget Display?
- ✓How Do You Filter the P&L Widget?
- ✓How Do You Use P&L Data for Tax Loss Harvesting?
- ✓How Is the P&L Widget Different from the Holdings Summary?
Why Is Tracking P&L More Complex Than It Looks?
The simple calculation — current value minus what you paid — misses most of what matters. It ignores dividends received, currency fluctuations, trading fees, and whether a position is still open or already closed. It also does not separate realized gains from unrealized ones, which matters enormously for tax planning.
Most spreadsheet-based trackers collapse all of this into a single number. The P&L widget breaks it apart so you can see the full picture.
Unrealized gains feel good. Realized gains pay taxes. Knowing the difference changes how you manage your portfolio.
What Does the P&L Widget Display?
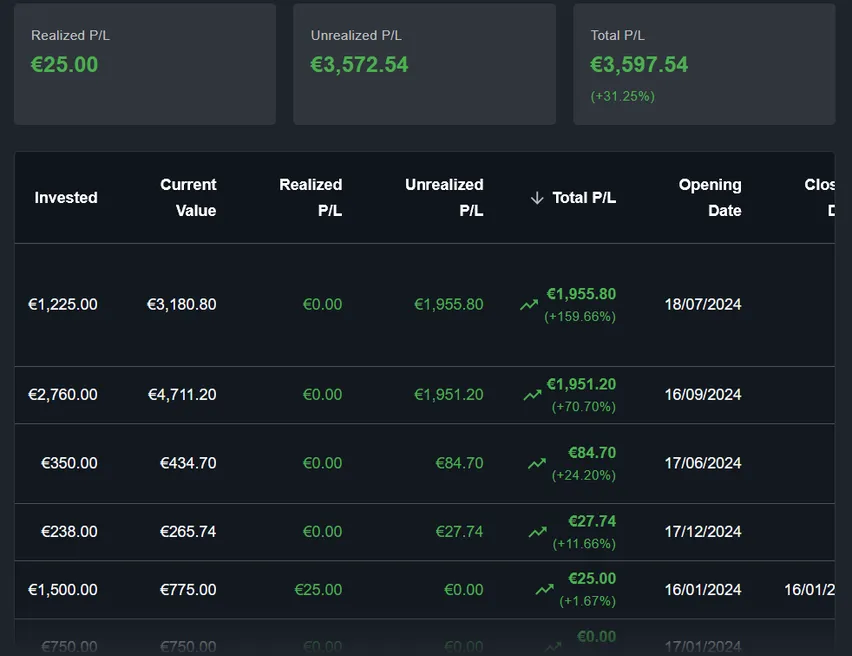
The widget shows a detailed breakdown of profit and loss across your holdings. For each position you can see: the total invested capital, the current or exit value, the absolute gain or loss in your base currency, and the percentage return. Dividends received are included separately so you can evaluate total return rather than price return alone.
The widget supports three position modes: open positions (assets you still hold), closed positions (assets you have fully sold), and all positions combined. This makes it equally useful for monitoring a live portfolio and reviewing completed trades.
How Do You Filter the P&L Widget?
Two main filters control what the widget shows. The portfolio filter lets you select one or more portfolios, or view all portfolios combined. The position type filter switches between open, closed, and all positions. Together these let you answer questions like: how did my growth portfolio perform this year on closed trades only?
You can also configure which columns appear in the table. If you do not need certain data points cluttering the view, hide them to keep the widget focused on what matters to you.
How Do You Use P&L Data for Tax Loss Harvesting?
Tax loss harvesting means selling a losing position to realize a loss that offsets taxable gains elsewhere. The P&L widget makes this straightforward:
- Switch to open positions and sort by gain/loss ascending to surface your biggest unrealized losses.
- Check the absolute loss against any realized gains you have already recorded this year.
- If harvesting makes sense, execute the sale in your broker — DonkyCapital will record the closed position automatically when you import the next transaction file.
- Switch to closed positions to confirm the realized loss is correctly accounted for.
How Is the P&L Widget Different from the Holdings Summary?
The Holdings Summary widget focuses on current live positions: what you hold right now, your average purchase price, and your unrealized gain. It is a snapshot of the present.
The P&L widget goes deeper: it includes closed positions, shows realized gains separately, covers any selected time period, and lets you configure exactly which columns to display. Use Holdings Summary for a quick daily overview and P&L for analysis and tax planning.
What Is the Difference Between Absolute and Percentage Return?
Both columns appear in the widget and both are useful, but they tell different stories. A position that gained 500 EUR on a 5,000 EUR investment returned 10%. Another that gained 200 EUR on a 400 EUR investment returned 50%. The absolute gain is higher in the first case; the percentage return is higher in the second.
When comparing positions of different sizes, percentage return is fairer. When thinking about how much a position has contributed to your overall wealth, absolute return matters more. The P&L widget shows both so you can switch perspective depending on the question you are trying to answer.
Can You Track Multiple Brokers in the Same P&L View?
Yes. DonkyCapital imports transactions from multiple brokers — DEGIRO, Scalable Capital, Fineco, Interactive Brokers, and others — and consolidates them into a single portfolio model. The P&L widget can then show the combined result across all brokers as if they were one portfolio.
You can also keep brokers in separate portfolios and use the portfolio filter to compare their performance side by side. This is useful if you deliberately run different strategies at different brokers.
Frequently Asked Questions
Does the P&L widget account for trading fees and commissions?
Yes. When you import transactions, fees are included in the cost basis. The P&L calculation uses the full cost including fees, so your net return is accurate.
Are dividends included in the P&L calculation?
Dividends are tracked separately from price return and shown as a distinct column. The total return column combines both so you can see the complete picture.
How does the widget handle currency conversion?
All values are converted to your account's base currency using the exchange rate at the time of each transaction. The currency impact is reflected in the overall gain or loss.
Can I see P&L for a specific time period only?
The time period filter on the widget controls the range. You can view year-to-date performance, the last 12 months, or any other supported period.
What is the difference between the P&L widget and the P&L Open and P&L Closed widgets?
The main P&L widget combines both open and closed positions and lets you switch between them with a filter. The dedicated P&L Open and P&L Closed widgets are pre-configured for each case, which is useful if you want both views visible on the dashboard at the same time without changing filters.
Does the widget update automatically when I add new transactions?
Yes. Every time you import a transaction file or sync via broker connection, the widget recalculates all P&L figures automatically.
Can I export the P&L data?
You can use the share button in the widget toolbar to export or share the current view.
See Your Real Portfolio P&L in Minutes
Connect your broker accounts and DonkyCapital calculates your full profit and loss history automatically — fees, dividends, and all positions included.
Start for free