How to Find Your Best and Worst Performing Assets with the Top Performers Widget
Not all assets in a portfolio perform equally — and knowing which ones are driving your returns (and which are dragging them down) is one of the most actionable pieces of information an investor can have. The Top Performers widget on DonkyCapital surfaces this instantly.
This guide explains how the widget works, how to configure it for different use cases, and how to use the ranking to make better portfolio decisions.
TL;DR
- ✓Why Does Ranking Asset Performance Matter?
- ✓What Does the Top Performers Widget Show?
- ✓How Do You Configure the Top Performers Widget?
- ✓How Many Assets Does the Widget Display?
- ✓How Do You Use the Ranking to Improve Your Portfolio?
Why Does Ranking Asset Performance Matter?
When you hold ten or twenty positions, it is easy to lose track of which assets are actually generating your returns. A diversified portfolio might show an overall gain of 12% — but if three positions returned 40% and the rest broke even, that changes the conversation about concentration risk and future allocation.
The Top Performers widget makes the ranking explicit. Instead of scanning a table and doing mental arithmetic, you see your best and worst performers sorted and ready to act on.
Diversification means some assets will always disappoint. Knowing which ones is half the battle.
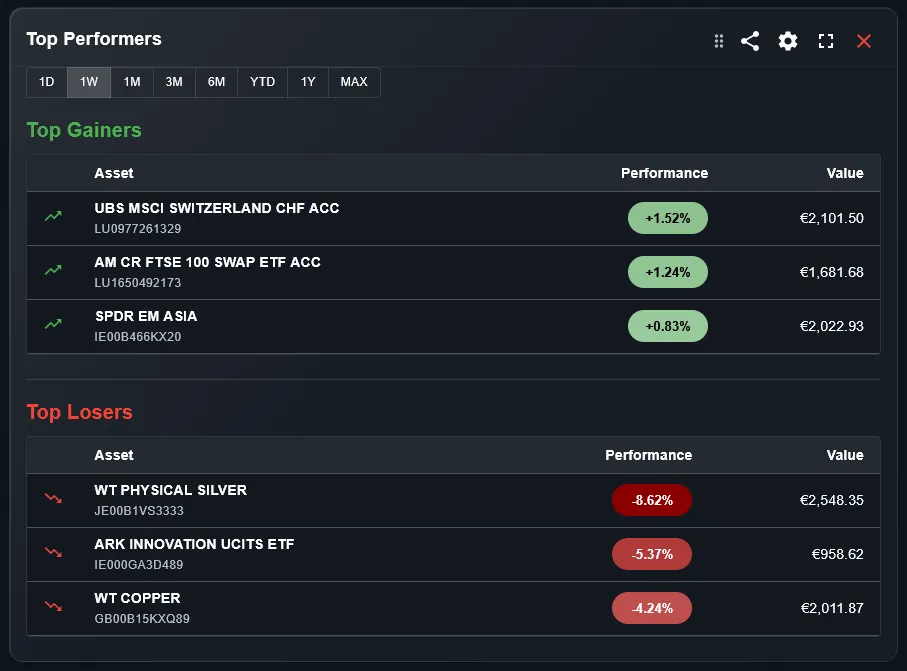
What Does the Top Performers Widget Show?
The widget displays a ranked list of your holdings sorted by performance over the selected time period. It shows both the top performers (your biggest winners) and the bottom performers (your biggest losers) in the same view, so you can immediately compare the two ends of your portfolio.
Each entry shows the asset name, the return in your chosen metric, and a visual indicator so you can scan the ranking at a glance. The widget is compact enough to keep always visible on your dashboard without taking up too much space.
How Do You Configure the Top Performers Widget?
Three settings control the widget output. The portfolio filter selects which portfolios to include — useful if you want to rank assets within a specific broker account or strategy. The time period sets the performance window: you can compare performance over the last month, quarter, year, or since inception.
The metric setting is the most impactful choice. Percentage return ranks assets by how much they grew relative to their cost — fairer when comparing positions of different sizes. Absolute return ranks by how much they gained in your base currency — more relevant when you want to know what actually moved the needle on your total wealth.
How Many Assets Does the Widget Display?
You can set the limit from 1 to 10 assets per end of the ranking. A limit of 3 gives you the top 3 and bottom 3 — a tight snapshot. A limit of 10 gives you a broader view that is useful for portfolios with many positions.
For most investors, a limit of 3 to 5 is the sweet spot: enough to understand the shape of the portfolio without overwhelming the dashboard.
How Do You Use the Ranking to Improve Your Portfolio?
The top performers view is useful for three decisions. First, concentration check: if one or two assets dominate the top of the ranking and represent a large share of your portfolio, you may be taking more risk than you realize. A strong performer that has grown to 20% of your portfolio might warrant partial rebalancing.
Second, the bottom performers reveal candidates for tax loss harvesting — selling a losing position to realize a loss that offsets gains elsewhere. Third, consistent bottom performers over multiple periods are worth reviewing: is the thesis still valid, or has the position become deadweight?
What Is the Difference Between Percentage and Absolute Return?
A position that gained 2,000 EUR on a 5,000 EUR investment returned 40%. Another that gained 3,000 EUR on a 30,000 EUR investment returned only 10%. In percentage terms the first wins; in absolute terms the second contributed more to your wealth.
Switch to percentage return when you want to evaluate which assets are compounding most efficiently. Switch to absolute return when you want to know what actually drove your portfolio's performance in monetary terms. The widget lets you toggle between both views.
Can You Use the Widget Across Multiple Brokers?
Yes. If you have imported transactions from multiple brokers into DonkyCapital, all positions are visible in a single unified portfolio model. The Top Performers widget can rank across all of them at once, or you can use the portfolio filter to rank within a single broker account.
This multi-broker view is especially useful for investors who deliberately hold different strategies at different brokers: you can quickly see which strategy is performing best over any time period.
Frequently Asked Questions
Does the widget show both open and closed positions?
The widget focuses on currently open positions. Closed positions are better analyzed with the P&L widget, which is designed specifically for completed trades.
Can I see the ranking for a specific sector or asset class?
The portfolio filter selects portfolios, not sectors. To focus on a specific sector, create a separate portfolio for that strategy and filter the widget to that portfolio.
How is performance calculated for assets held across multiple purchases?
Performance is calculated using the weighted average cost basis across all purchases of that asset. If you bought the same ETF three times at different prices, the return shown reflects your blended entry price.
Does currency fluctuation affect the ranking?
All values are converted to your base currency, so currency movements are included in the performance figures. An asset that grew 10% in USD but lost 5% due to EUR/USD moves will show a net return of approximately 5% in EUR.
How often does the widget update?
The widget recalculates automatically every time you import new transactions or market prices update. For intraday tracking, the refresh interval can be configured when viewing 1-day performance.
Can I add multiple instances of this widget with different settings?
Yes. You can add the same widget multiple times with different configurations — for example, one showing 1-month percentage return and another showing 1-year absolute return — and keep both visible on your dashboard.
See Which Assets Are Really Driving Your Returns
Connect your broker accounts and DonkyCapital ranks your top and bottom performers automatically — across all portfolios, in any currency.
Start for free