Real Portfolio Return: Difference Between ROI, TWR and IRR [With Practical Examples]
Your broker shows you +83% performance. But is that really your portfolio's return? Not always. The difference between how your broker calculates gain and how you should calculate it can be huge — especially if you have made periodic contributions or withdrawals over the years.
In this guide we analyse the three fundamental metrics for calculating portfolio return: Simple ROI, TWR (Time-Weighted Return) and IRR/MWRR (Money-Weighted Rate of Return). With formulas, concrete numerical examples and a case study based on real data.
Table of Contents
- Why the broker's "Gain %" is misleading
- Simple ROI: formula, uses and limitations
- TWR / TWRR: the benchmark metric
- IRR / MWRR: the return on your capital
- Comparison: which metric to use in each situation
- How DonkyCapital calculates metrics automatically
- Real case study: two portfolios compared
- Frequently asked questions
Why the Broker's "Gain %" is Misleading
The gain percentage shown by most brokers is simply the ratio between the current profit and the total capital invested. It's an intuitive measure, but it hides a fundamental problem: it does not account for when you invested the money.
- ▸Ignores the timing of cash flows: additional contributions and withdrawals distort the figure.
- ▸Not comparable with benchmarks: the MSCI World or your reference fund uses TWR, not simple ROI.
- ▸Varies with the amount invested: adding capital during a downturn can make performance look worse than it actually was.
The broker's "Gain %" measures how much your balance grew. It does not measure the quality of your investment decisions.
Simple ROI: Formula, Uses and Limitations
The Simple Return on Investment (ROI) — also called Simple Return or Performance — is the most immediate metric: how much the portfolio is worth today compared to how much you have invested in total.
Formula
ROI = (Valore Attuale − Capitale Investito) / Capitale Investito × 100
Numerical Example
You invested €6,000 in an ETF. Today the portfolio is worth €10,998.
ROI = (10.998 − 6.000) / 6.000 × 100 = +83,3%
When to use it
- ✓ Single lump-sum investment with no subsequent contributions
- ✓ Quick comparison between individual positions
- ✓ Evaluation of a single trade
Limitations
- ✗ Distorted by contributions and withdrawals over time
- ✗ Not comparable with benchmarks or other managers
- ✗ Does not account for the time horizon
TWR / TWRR: The Benchmark Metric
The Time-Weighted Rate of Return (TWR or TWRR) is the standard metric used by the financial industry to measure portfolio performance independently of cash flows. It is mandatory for investment funds precisely because it allows objective comparisons: no matter when the client added or withdrew money, TWRR measures only the quality of asset management.
The principle is simple: the investment period is divided into sub-periods every time there is a cash flow. The return for each sub-period is calculated, then they are multiplied together (compounding).
Formula
TWRR = [(1 + R₁) × (1 + R₂) × ... × (1 + Rₙ)] − 1
where R₁...Rₙ are the returns of the sub-periods between each cash flow
Practical Example
You have €10,000 invested. Mid-year you add €5,000. At year-end the portfolio is worth €18,000.
- → Sub-period 1 (start → contribution): portfolio goes from €10,000 to €14,000 → R₁ = +40%
- → Sub-period 2 (contribution → year-end): from €19,000 to €18,000 → R₂ = −5.3%
- → TWRR = (1.40 × 0.947) − 1 = +32.6%
The TWRR is +32.6% — it reflects only asset performance, not the fact that you added capital just before the decline.
Advantages
- ✓ Comparable with benchmarks (MSCI World, S&P 500)
- ✓ Not distorted by contributions/withdrawals
- ✓ International standard for funds (GIPS)
Limitations
- ✗Does not tell you how much you earned on your capital
- ✗Ignores the impact of your cash flow timing decisions
IRR / MWRR: The Return on Your Capital
The Money-Weighted Rate of Return (MWRR) — also known as IRR (Internal Rate of Return) or XIRR in Excel — measures the effective return on your invested capital, accounting for when you invested each euro. Unlike TWR, IRR assigns more weight to periods when you had more capital invested.
«What is the annualised rate of return that makes the present value of my cash flows equal to the final portfolio value?»
Definition (intuitive form)
MWRR = tasso r tale che: ΣCFₜ / (1+r)ᵗ = Valore Finale
CFₜ = cash flow at time t (negative if contribution, positive if withdrawal)
In practice, use the XIRR function in Excel or a tool like DonkyCapital which calculates it automatically
Practical Example — same scenario as above
You invested €10,000 at the start of the year and €5,000 mid-year. Year-end: portfolio worth €18,000.
- → TWRR: +32.6% (as above)
- → MWRR: approx. +22%
The MWRR is lower because you added €5,000 after the portfolio had already gained a lot (+40%) and just before a decline (−5.3%). Your capital bore the loss on a larger base.
TWRR vs MWRR: the key difference
TWRR > MWRR: you added capital at unfavourable times (at high prices or before declines). The market performed well, but your timing reduced the real return on your money.
MWRR > TWRR: you invested more capital at the right moments (at low prices or before rallies). Your cash flow management amplified gains relative to pure market performance.
Comparison: Which Metric to Use in Each Situation
There is no single "best" metric. Each measure answers a different question:
| Question | Metric to use |
|---|---|
| How much is my portfolio worth compared to what I invested? | Simple ROI (Performance %) |
| Am I beating the MSCI World or my benchmark? | TWRR (Time-Weighted Return) |
| What is the annualised return on my capital? | MWRR / IRR (Money-Weighted Return) |
| Did I choose the right moments to invest? | TWRR vs MWRR comparison |
| Do I need to compare two managers or two funds? | TWRR (eliminates cash flow effect) |
| Do I want to replicate Excel XIRR results? | MWRR / IRR |
How DonkyCapital Calculates Metrics Automatically
Calculating TWRR and MWRR manually on a portfolio with dozens of transactions across multiple brokers is complex and error-prone. DonkyCapital does it automatically for all imported portfolios, showing TWRR, annualised TWRR and MWRR side by side — giving you the complete picture at a glance.
- ▸TWRR (Time-Weighted Return Rate): cumulative return since the portfolio was opened, independent of cash flows.
- ▸TWRR Y (annualised): TWRR converted to an annual rate — useful for comparing portfolios opened at different times.
- ▸MWRR (Money-Weighted Return Rate): the effective return on your capital, accounting for when you invested each euro.
Real Case Study: Two Portfolios Compared
Here is a concrete example from the DonkyCapital dashboard. Two portfolios with the same invested capital (€6,000 each) show very different metrics — and reading TWRR and MWRR side by side tells two completely different stories.
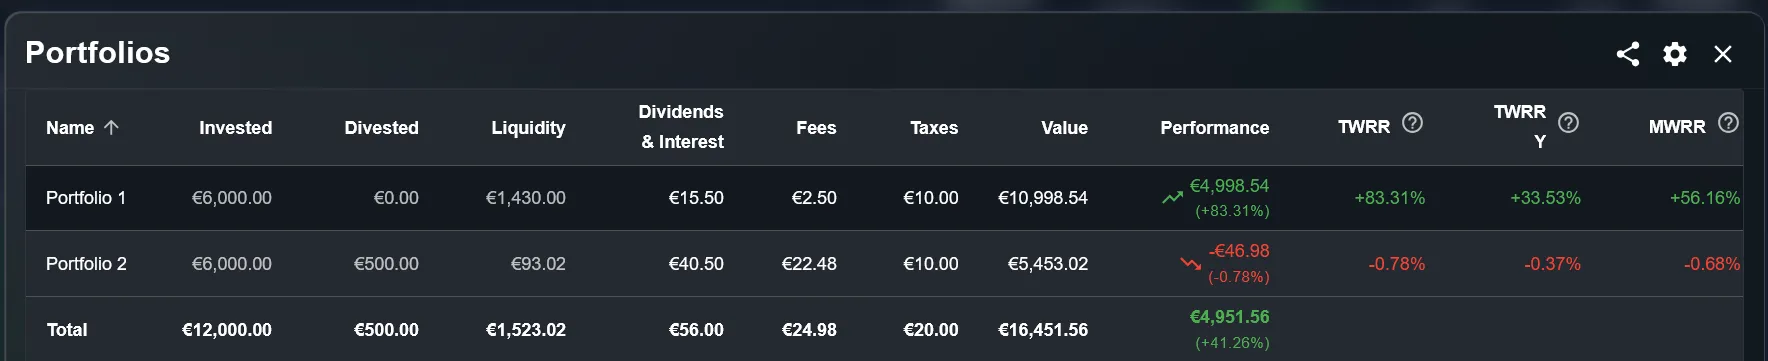
Portfolio 1 — Strong growth
- Invested€6.000
- Current Value€10.998,54
- Performance (ROI)+83,31%
- TWRR+83,31%
- Annualised TWRR+33,53%
- MWRR+56,16%
Portfolio 2 — Negative performance
- Invested€6.000
- Divested€500
- Current Value€5.453,02
- Performance (ROI)−0,78%
- TWRR−0,78%
- Annualised TWRR−0,37%
- MWRR−0,68%
Frequently Asked Questions
Do TWRR and MWRR always give different results?
No. If you invested all the capital in a single lump sum with no subsequent contributions or withdrawals, TWRR and MWRR are identical. Differences only arise when there are multiple cash flows over time.
What is the difference between MWRR and Excel's XIRR?
They are the same thing expressed differently. Excel's XIRR calculates the internal rate of return accounting for the exact dates of each cash flow — that is exactly the MWRR. DonkyCapital uses the same algorithm automatically.
Which metric should I use to compare myself with an ETF or the MSCI World?
Always use TWRR (or annualised TWRR). Benchmarks like the MSCI World are calculated using the time-weighted method. Only TWRR guarantees an objective comparison.
If my TWRR is much higher than my MWRR, is that a problem?
Not necessarily. It means you added capital at unfavourable times. It is valuable information to reflect on your approach to periodic contributions, but it does not indicate an error in asset management.
Calculate Your Portfolio's TWRR and MWRR
Stop relying on the simple "Gain %" from your broker. With DonkyCapital you get ROI, TWRR and MWRR calculated automatically for all your portfolios — across any broker.
Access DonkyCapital FreeFree Early Access · No credit card required