The Portfolio Tracker that replaces your spreadsheets.
The smart portfolio tracker for ETF, stock and crypto investors. Monitor all your assets in one customizable dashboard, import CSV/XLSX from any broker (even unsupported ones) with AI Magic Importer, and access advanced analytics with heatmap, detailed P&L, financial goals, and rebalancing alerts.
5.0 · 7 reviews on Trustpilot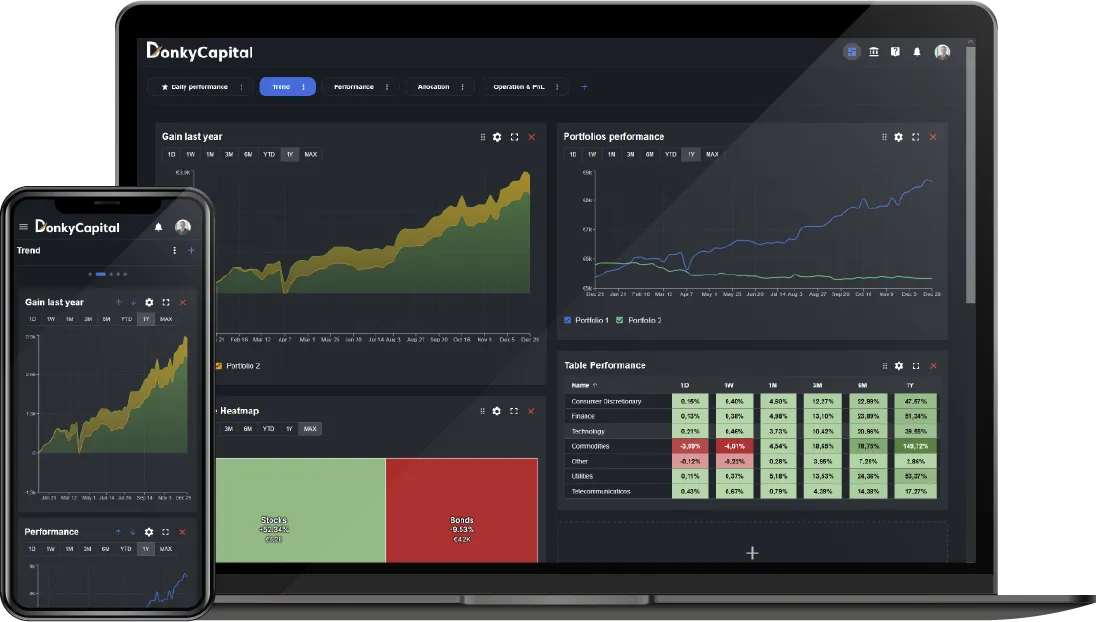
Portfolio Tracker for ETFs, Stocks & Crypto
Customize every chart, every metric, every widget. It’s your portfolio.
100% Customizable Dashboard
Drag & drop, save configurations, multiple dashboards: create the perfect view for your investment strategy. Multi-period performance, detailed Profit & Loss, visual heatmaps to quickly identify opportunities and risks.
Multi-Portfolio
Manage multiple portfolios, import CSV/XLSX from any broker — even unsupported ones — and get real-time calculations.
+ many more being integrated
AI Magic Importer
Upload any CSV, XLSX or XLS statement from any bank or broker. Our AI recognizes the format and converts your transactions automatically — even for unsupported brokers.
Multi-Currency
Track investments in USD, EUR, CHF, GBP and 16 more currencies. Automatic real-time conversion across all your brokers — no spreadsheets, no manual exchange rates.
All Your Assets, One Dashboard
Stocks, ETFs, crypto and unlisted assets (real estate, private equity, art) together in a unified portfolio. Automatic prices for listed instruments, manual updates for the rest.
Financial Goals
Set a target amount in €, a deadline, and an expected annual return. The widget shows in real time whether you are ahead or behind, with the amount needed to stay on track.
Rebalancing Alerts
Set a target % and tolerance threshold for each asset class. Receive email and in-app notifications when your portfolio drifts from the desired allocation.


Your portfolio, analyzed by AI
Ask questions in natural language. The AI already knows all your portfolios, positions, and brokers.
Financial context loaded
Your portfolio profile is automatically synthesized at the start of every session.
Natural language
No commands to learn. Write as you would talk to a financial advisor.
Analysis on your real data
Not generic answers: the AI cites your specific portfolios and positions in responses.
Customize every chart, every metric, every widget. It’s your portfolio.
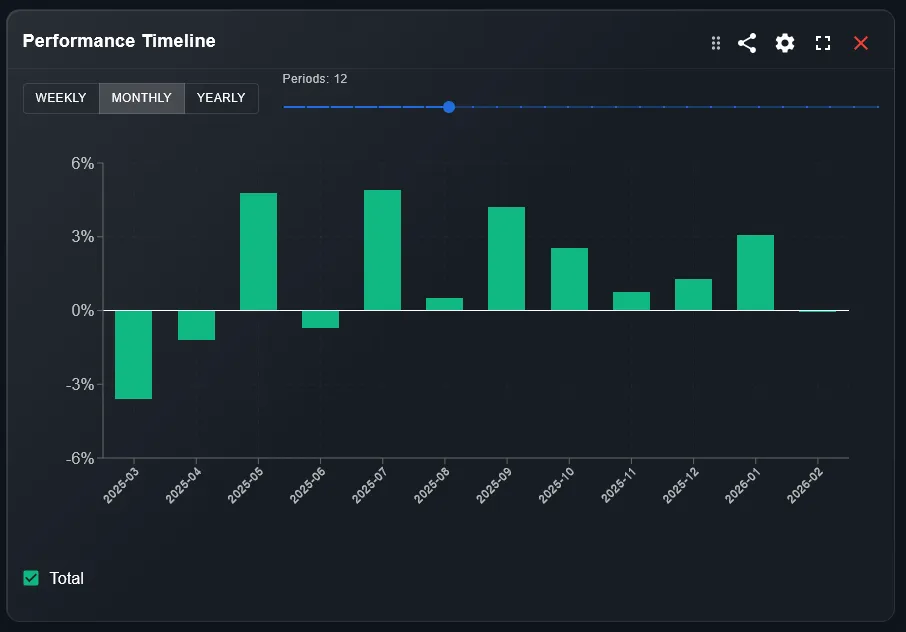
Monthly and yearly breakdown of portfolio performance with benchmark comparison.
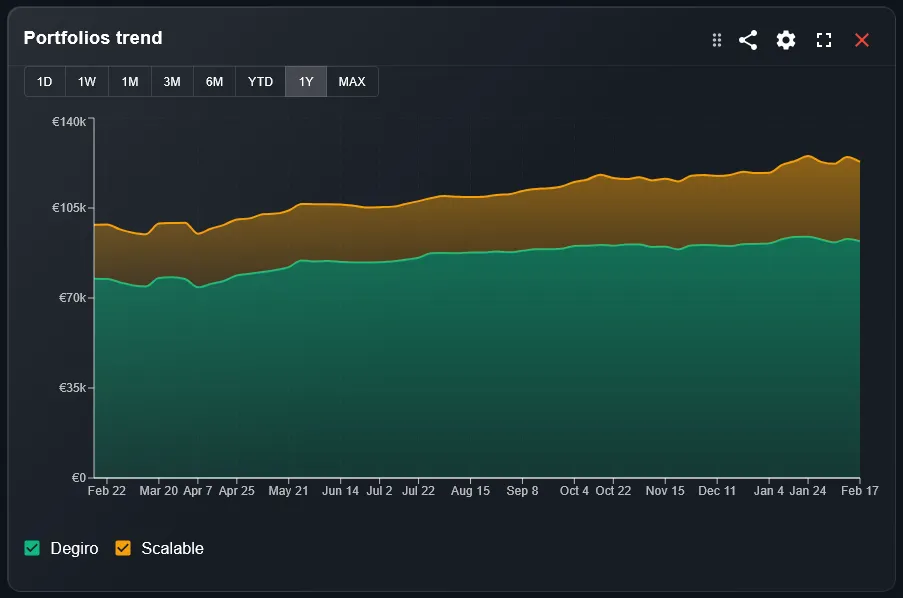
Temporal evolution of portfolio value with stacked area chart.
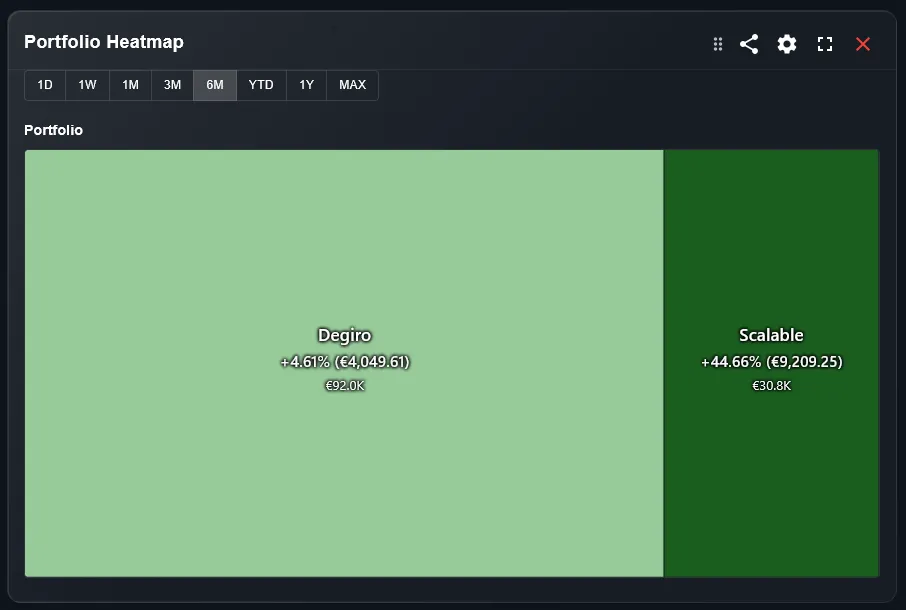
Heat map visually comparing performance and weight by category.
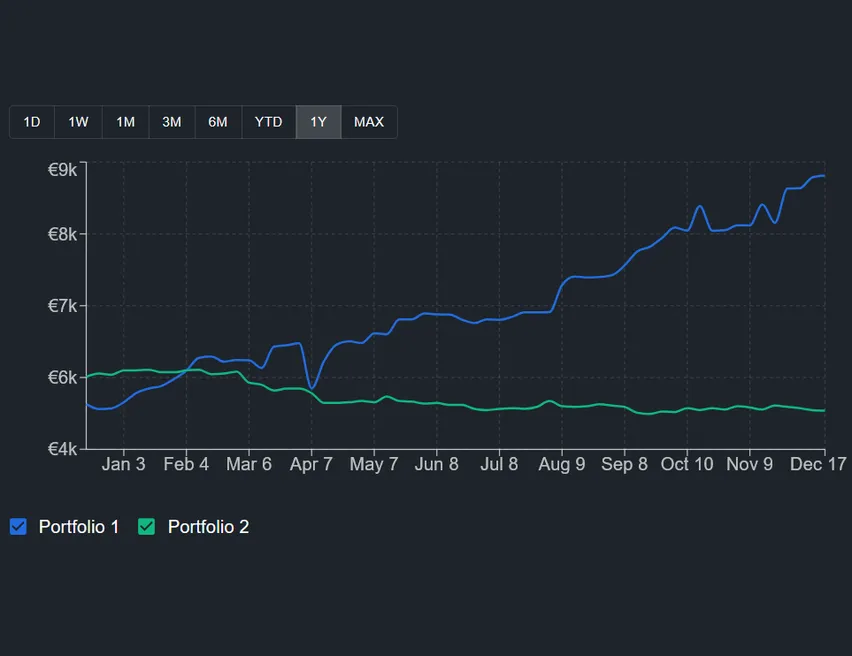
Temporal performance trend by portfolio/type/class/currency/sector/country.
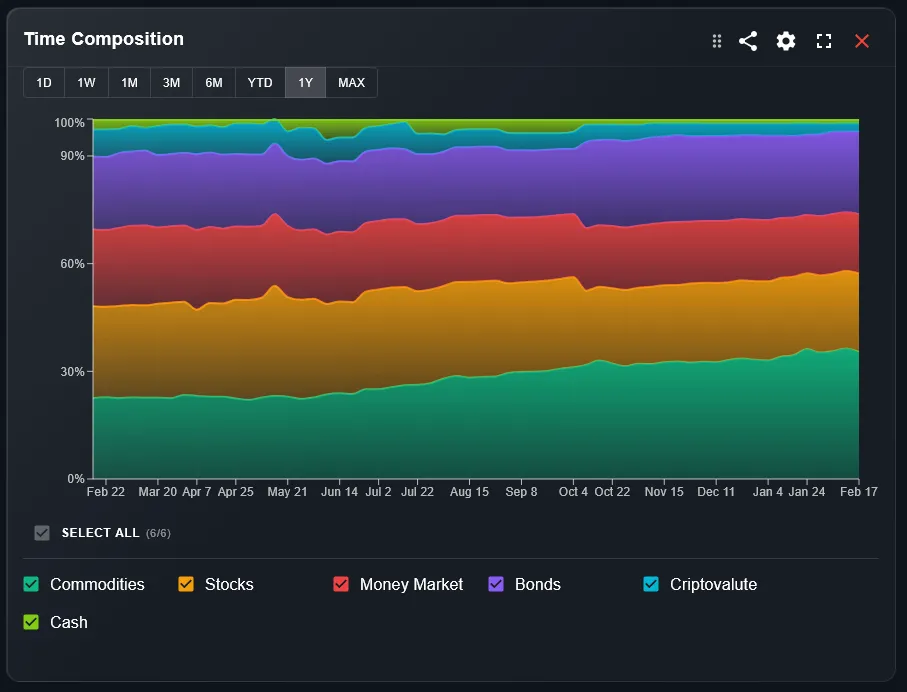
Displays the percentage composition of the portfolio over time.
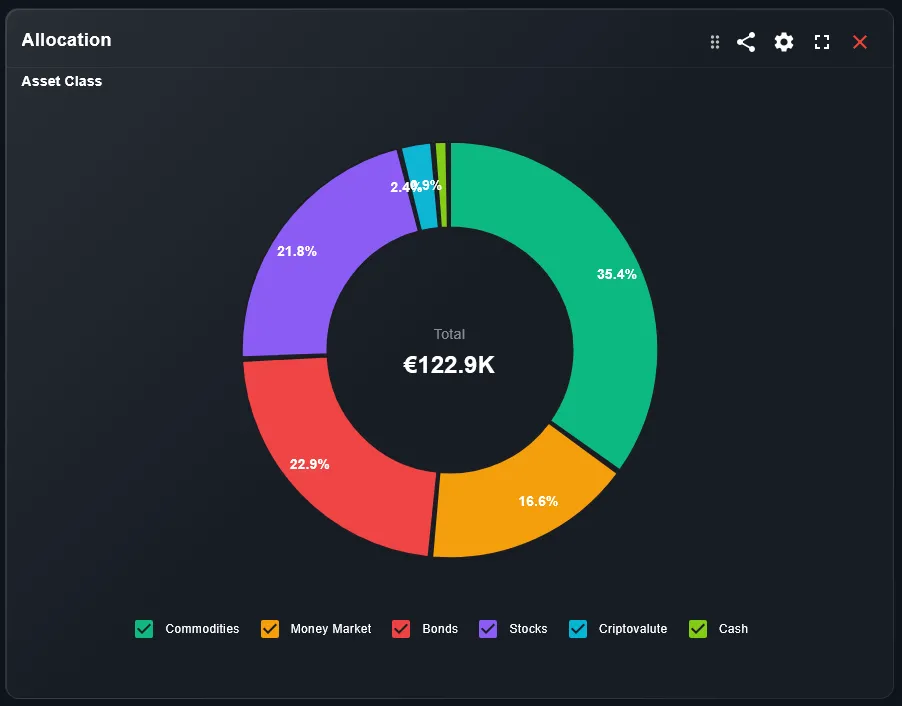
Pie chart displaying portfolio percentage distribution.
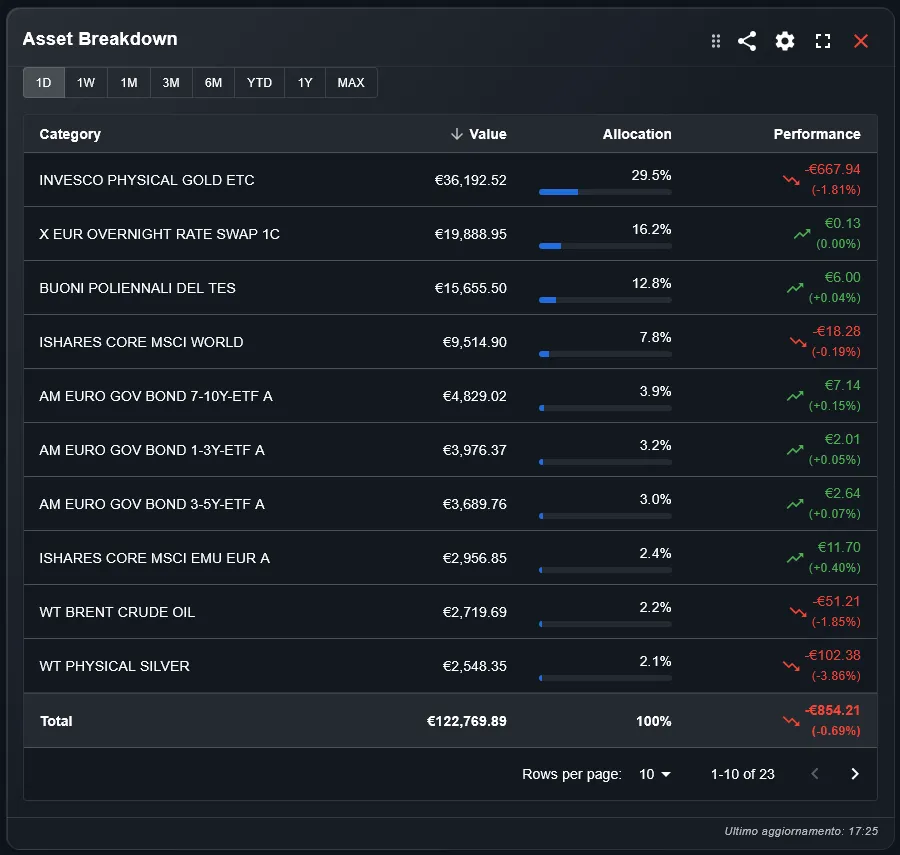
Analytical table listing weight, value, and performance for each category.
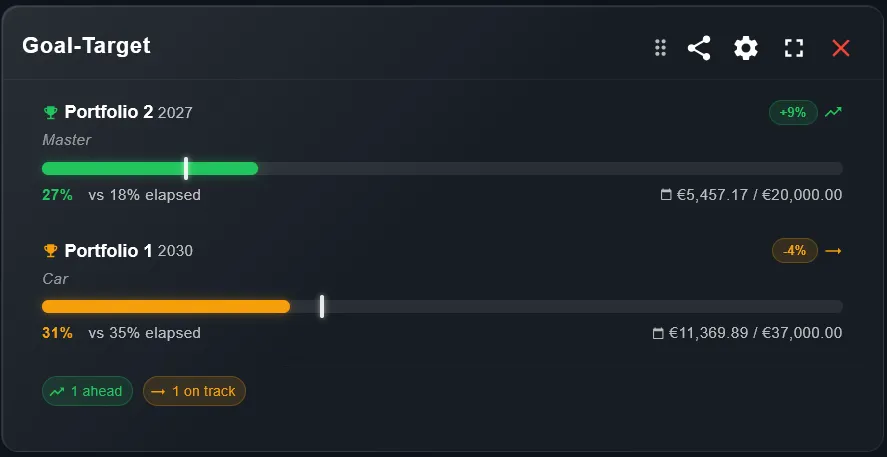
Track progress toward a target portfolio value with a visual gauge and time-to-goal estimate.
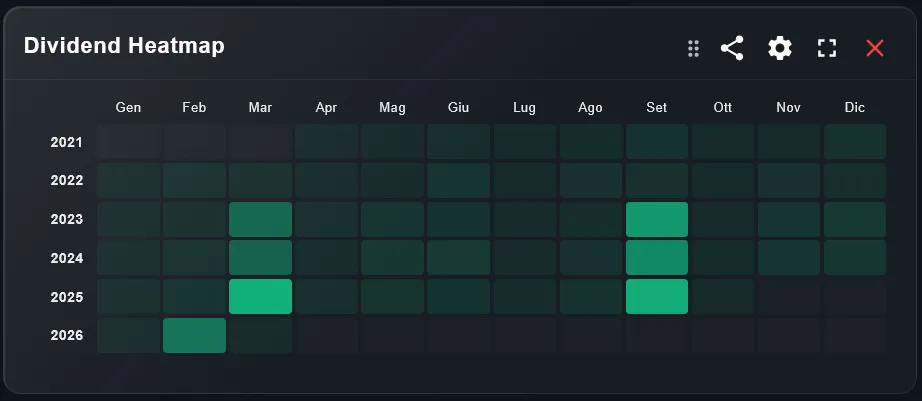
Visualise which months you received dividends year by year with a colour-coded heatmap calendar.
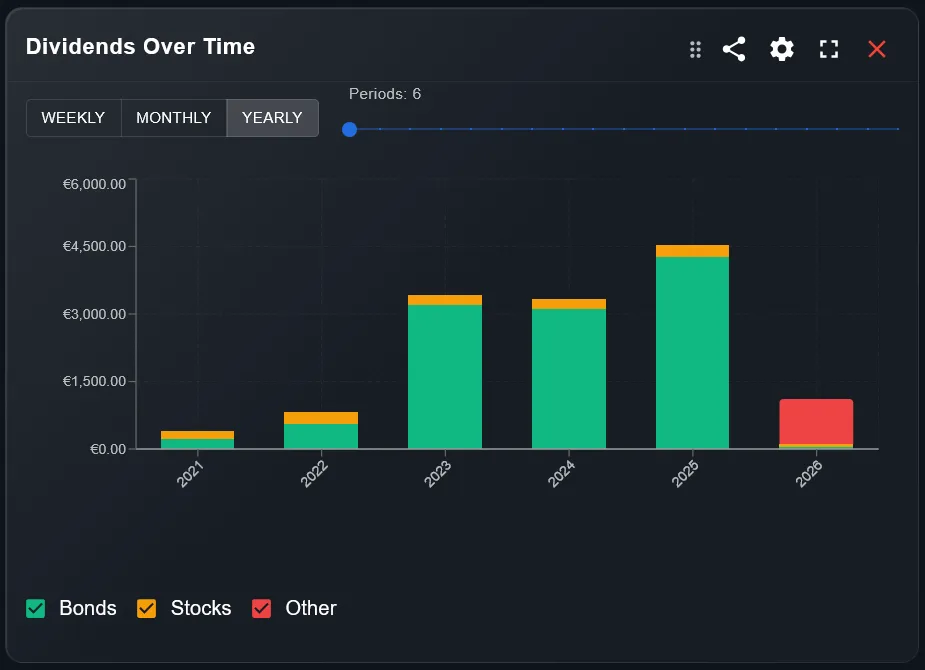
Bar chart of dividends collected by period (weekly, monthly, yearly) broken down by asset class.
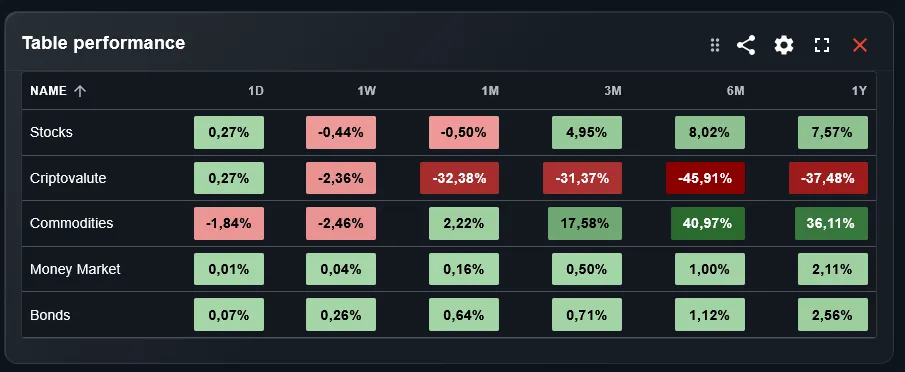
Performance over 6 time horizons with trend icons (1D, 1W, 1M, 3M, 6M, 1Y).
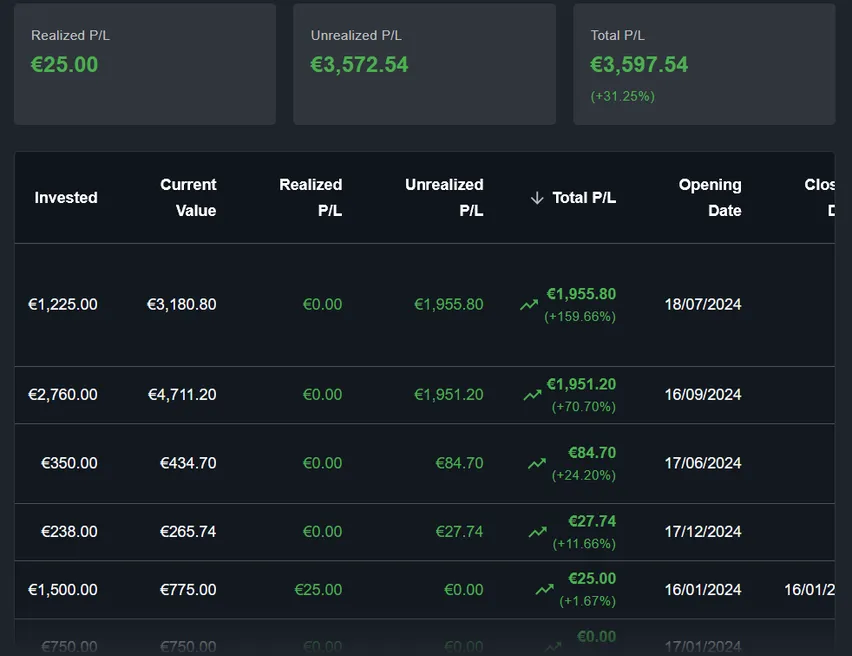
Complete view of portfolio profits and losses.
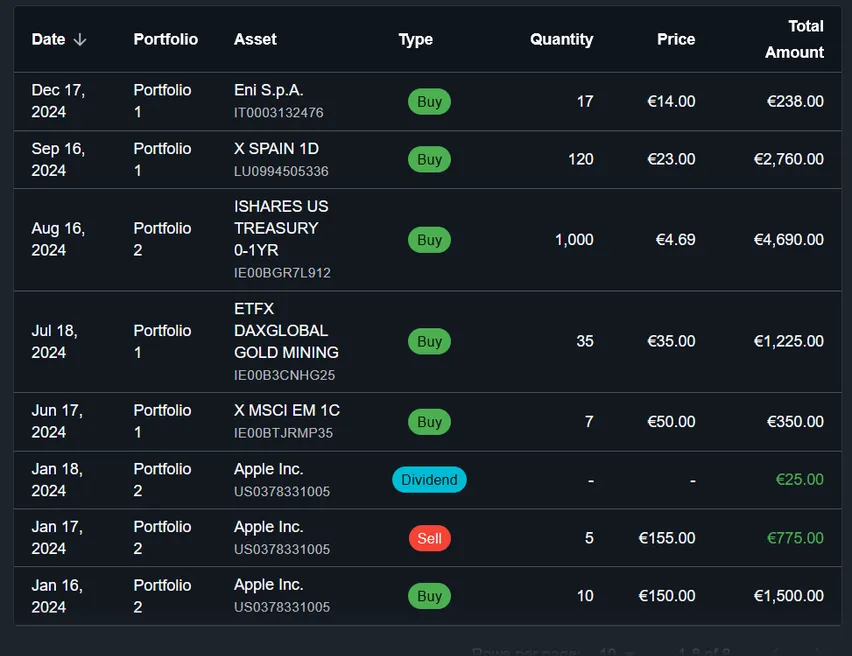
List of the latest transactions in chronological order.
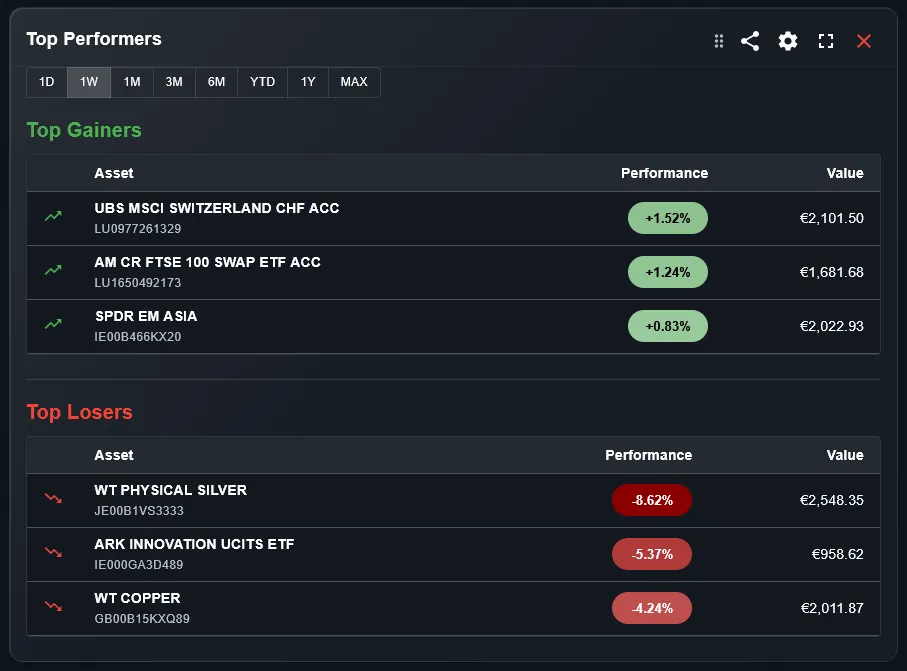
Ranks your best and worst performing assets by return over a selected time period.
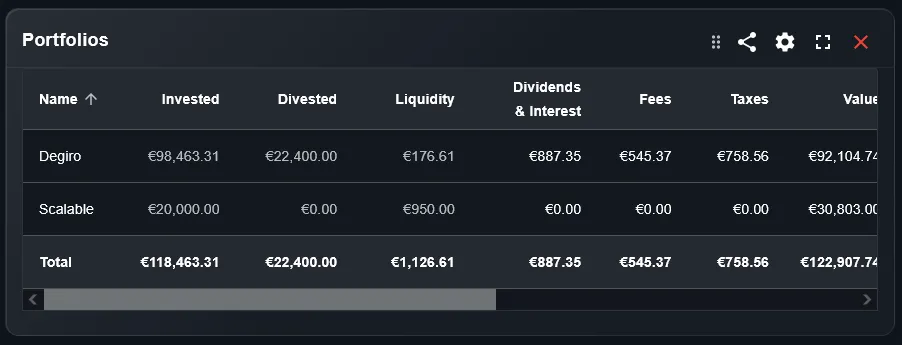
Complete table listing all portfolios with their key values.
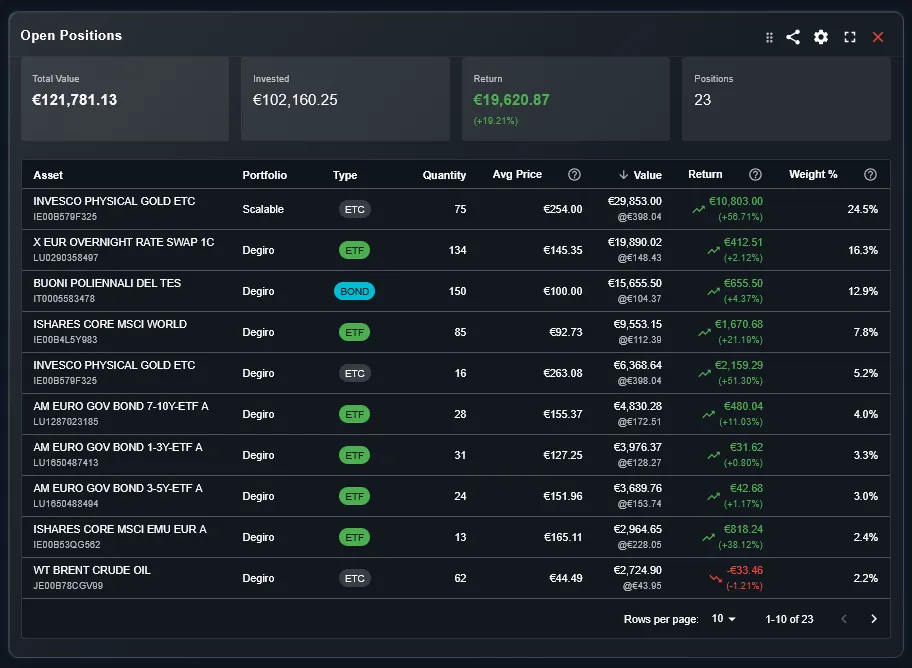
Complete list of currently open positions with ALP and performance.
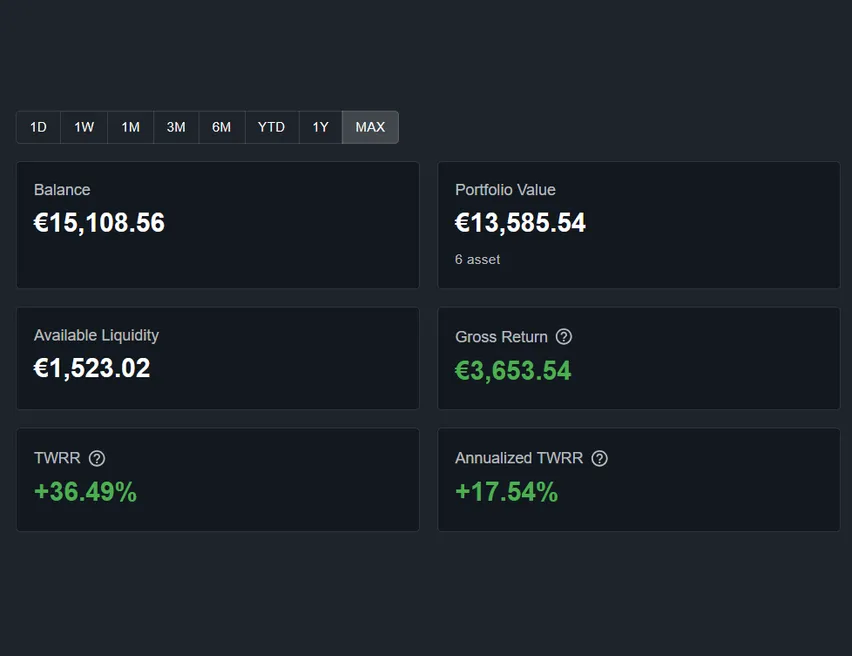
Synthetic overview of the portfolio with five key indicators.
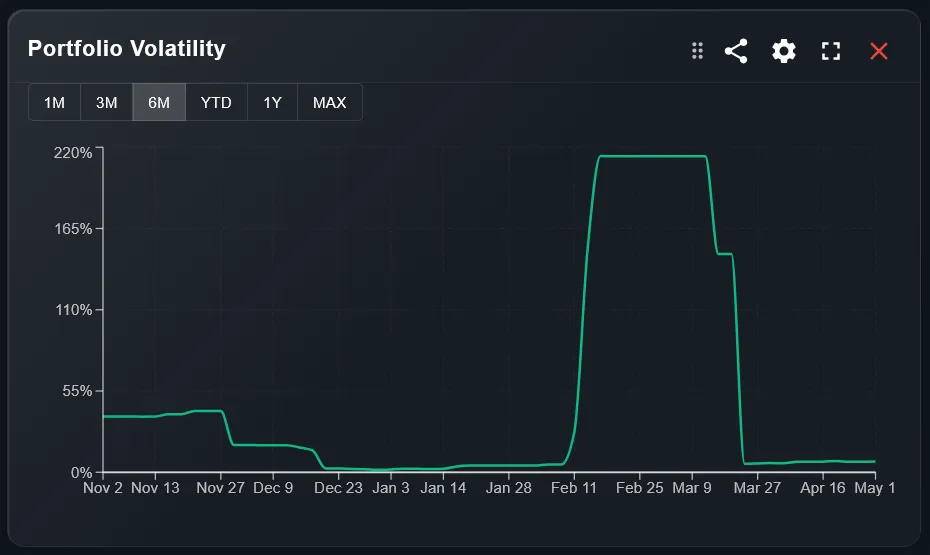
Monitor your portfolio volatility over time with customizable time periods.
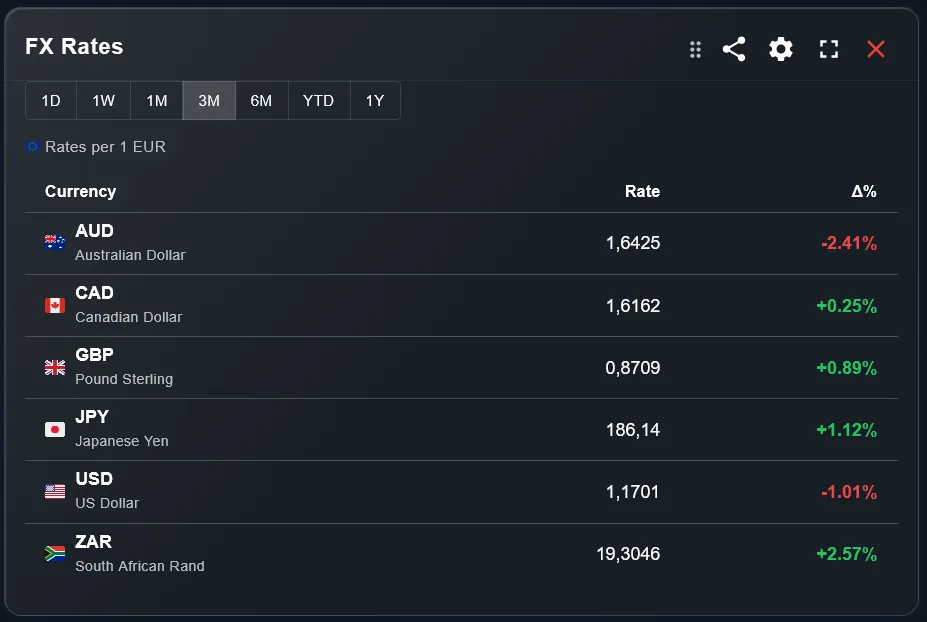
Track live FX exchange rates across major currencies with period-over-period change.
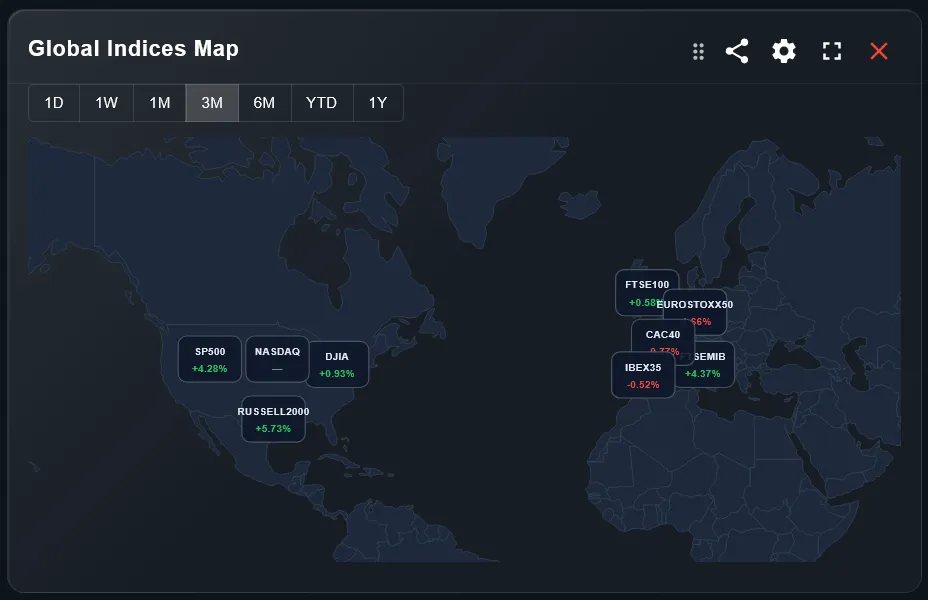
Visualize major global stock indices on an interactive world map with real-time performance.
Monthly and yearly breakdown of portfolio performance with benchmark comparison.
Temporal evolution of portfolio value with stacked area chart.
Heat map visually comparing performance and weight by category.
Temporal performance trend by portfolio/type/class/currency/sector/country.
Displays the percentage composition of the portfolio over time.
Pie chart displaying portfolio percentage distribution.
Analytical table listing weight, value, and performance for each category.
Track progress toward a target portfolio value with a visual gauge and time-to-goal estimate.
Visualise which months you received dividends year by year with a colour-coded heatmap calendar.
Bar chart of dividends collected by period (weekly, monthly, yearly) broken down by asset class.
Performance over 6 time horizons with trend icons (1D, 1W, 1M, 3M, 6M, 1Y).
Complete view of portfolio profits and losses.
List of the latest transactions in chronological order.
Ranks your best and worst performing assets by return over a selected time period.
Complete table listing all portfolios with their key values.
Complete list of currently open positions with ALP and performance.
Synthetic overview of the portfolio with five key indicators.
Monitor your portfolio volatility over time with customizable time periods.
Track live FX exchange rates across major currencies with period-over-period change.
Visualize major global stock indices on an interactive world map with real-time performance.
How it works
Import
Connect your broker or upload a CSV/XLSX file. Don't see yours? The AI Magic Importer reads any statement format automatically.
Plan
Set financial goals with a target amount and deadline. Configure allocation targets for each asset class.
Monitor
Receive alerts when your portfolio drifts from the target. Track progress and act at the right time.
Who uses DonkyCapital
Retail Investor
“I have ETFs across 3 brokers, a house goal and a retirement goal — I see everything in one place and always know if I'm on track.”
Part-Time Trader
“I track P&L for every position, I know exactly how much I'm earning.”
Financial Advisor
“Each client has their own dashboard with personalized goals. In one minute I can see who is ahead and who needs to increase contributions.”
Read the full story →Plans
taxes incl.
Free
- 1 portfolio
- 100 transactions
- AI Insights 1x~10 AI responses per week
- 5 dashboards
- Import from major brokers
- Portfolio value
- Performance analysis
- Allocation & risk analysis
- P&L
✓ No credit card required
Start for freeStandard
or €5,99/month
- 5 portfolios
- 500 transactions
- AI Insights 5x~50 AI responses per week
- 5 dashboards
- Import from major brokers
- Portfolio value
- Performance analysis
- Allocation & risk analysis
- P&L
Premium
or €9,99/month
- 10 portfolios
- Unlimited transactions
- AI Insights 20x~200 AI responses per week
- 8 dashboards
- Import from major brokers
- Portfolio value
- Performance analysis
- Allocation & risk analysis
- P&L
Frequently Asked Questions
It is a smart Portfolio Tracker that eliminates manual data entry, providing real-time ETF/Stock prices and automatic exposure analysis.
Portfolio rebalancing guide →Never. We prioritize privacy: you simply import your data via CSV/PDF files without ever sharing your broker login details.
Read the Privacy Guide →You can set a goal with a target amount in €, a deadline, and an expected annual return. DonkyCapital automatically calculates whether you are ahead or behind and shows you the amount to invest to stay on track.
Financial goals guide →A rebalancing alert notifies you when one or more positions drift beyond your defined tolerance threshold. You can receive it by email or as an in-app notification, monitoring by individual asset or by asset class.
Rebalancing alerts guide →Yes! With our free Chrome Extension, you can download your transaction CSV even on the Free plan, saving the Prime+ subscription cost.
DonkyCapital offers deeper dashboard customization and superior privacy by avoiding direct broker account linking.
You can track ETFs, stocks, bonds, crypto, and non-listed funds. It is a comprehensive multi-asset portfolio tracker.
Yes, DonkyCapital is a PWA (Progressive Web App). Install it on your mobile device for seamless tracking without needing an App Store download.
Your data is stored securely in Europe and encrypted. We prioritize your privacy and never ask for your broker credentials.
AI Insight is the built-in chat that analyzes your portfolio. Ask questions in natural language — about diversification, rebalancing, exposures — and get answers based on your real data, not generic advice.
Read the Privacy Guide →Yes. When you open the chat, your portfolio profile is automatically synthesized: asset class allocation, geographic distribution, and currency exposures are already available to the AI — no manual input needed.
Discover AI Insight →Yes! With the AI Magic Importer you can upload any CSV, XLSX or XLS account statement from any bank or broker. Our AI automatically recognizes the file type and converts the transactions into DonkyCapital format — even for completely unknown file formats. Each upload processes up to 100 rows for maximum accuracy; for large imports, we recommend using your broker's dedicated importer if available. Your data is shared securely with the AI provider and never used for training.
Discover AI Insight →Ready to take control of your investments?
2-minute setup. No commitment. Cancel anytime.